
OCTOBER MARKET INSIGHT
The Fall Market Is Telling a Different Story. And the Details Matter
Every month, we try to look beyond the headlines and ask, What are these numbers really telling us?
October gave us another important look at how the real estate market is changing as we move toward the end of 2026.
After an extraordinary spring selling season, we’ve watched buyer activity slow, inventory increase, and the intense competition of earlier this year become much less predictable.
But here’s what’s interesting.
Prices remain significantly higher than they were a year ago, even as fewer homes are selling in Maplewood. And South Orange continues to tell a very different story.
In October, homes in both towns continued to sell above asking price on average. But the premiums weren’t nearly as dramatic as they were during the height of the spring market, and we’re seeing a much wider range of outcomes depending on the individual property.
That’s an important distinction.
A strong market doesn’t mean every home will sell quickly or command multiple offers. And a slower market doesn’t mean buyers have stopped looking.
The market is has simply changed. Understanding exactly how it’s changing is what matters.
Maplewood: Fewer Sales, But Prices Remain Historically Strong
October was another relatively quiet month in Maplewood.
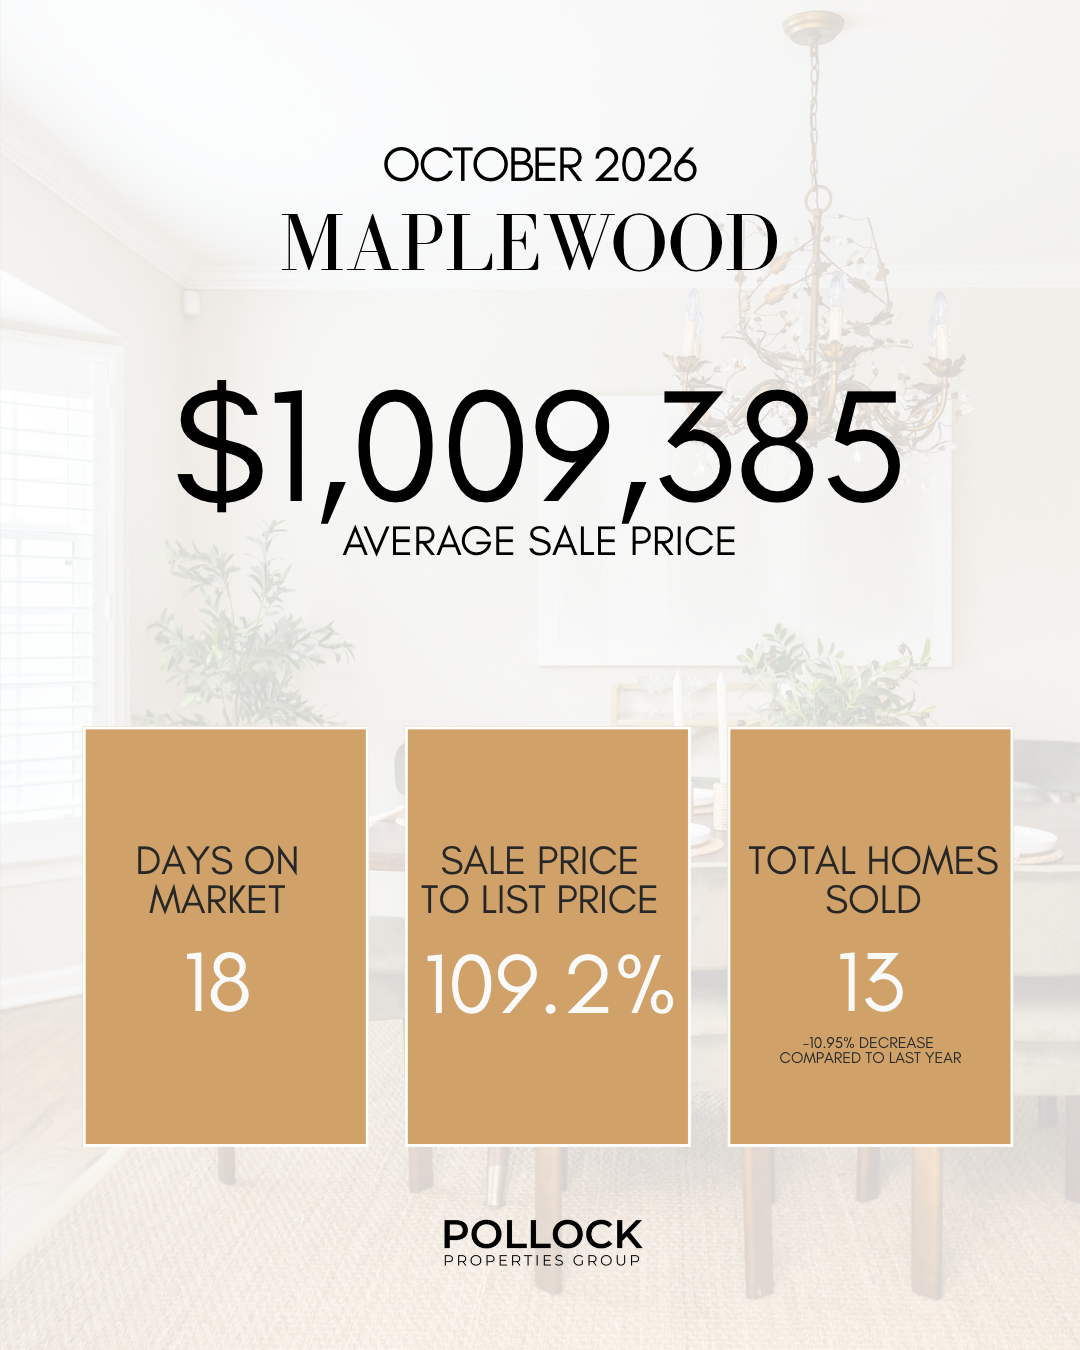
The average sales price was $1,009,385, down from September’s $1,156,504. Homes sold for an average of 109.21% of list price and spent 18 days on the market.
During October:
13 homes sold
16 homes went under contract
27 homes were actively available for sale
The number of closings declined from 17 in September to just 13 in October. And while available inventory remained steady at 27 homes, fewer properties went under contract.
That’s a meaningful change from the extraordinary pace we experienced during the spring.
But October also showed us just how different individual sales can be.
Some homes sold at or below asking price, while others still commanded significant premiums. One home sold for more than 124% of list price, demonstrating that buyers are still willing to compete aggressively when they see exceptional value.
The year-to-date numbers tell an even bigger story.
Compared with the same period in 2025:
Average sales prices are up 21.21%
The number of homes sold is down 10.95%
The average sale-to-list price ratio is 115.47%
Average days on market are down approximately 9.16%
Through October, 187 homes have sold in Maplewood, compared with 210 during the same period last year.
Meanwhile, the year-to-date average sales price has climbed to $1,228,922, compared with $1,013,906 in 2025.
Think about that.
Nearly 11% fewer homes have sold, yet the average sales price is more than 21% higher.
That continues to be one of the most remarkable stories of the 2026 Maplewood market.
We simply haven’t had enough homes available to satisfy the demand we’ve experienced throughout much of the year.
But October reminds us that even in a market defined by limited inventory, pricing and preparation still determine how buyers respond.
South Orange: More Homes Sold, Higher Prices, and a Different Kind of Market
South Orange continues to tell a fascinating story.
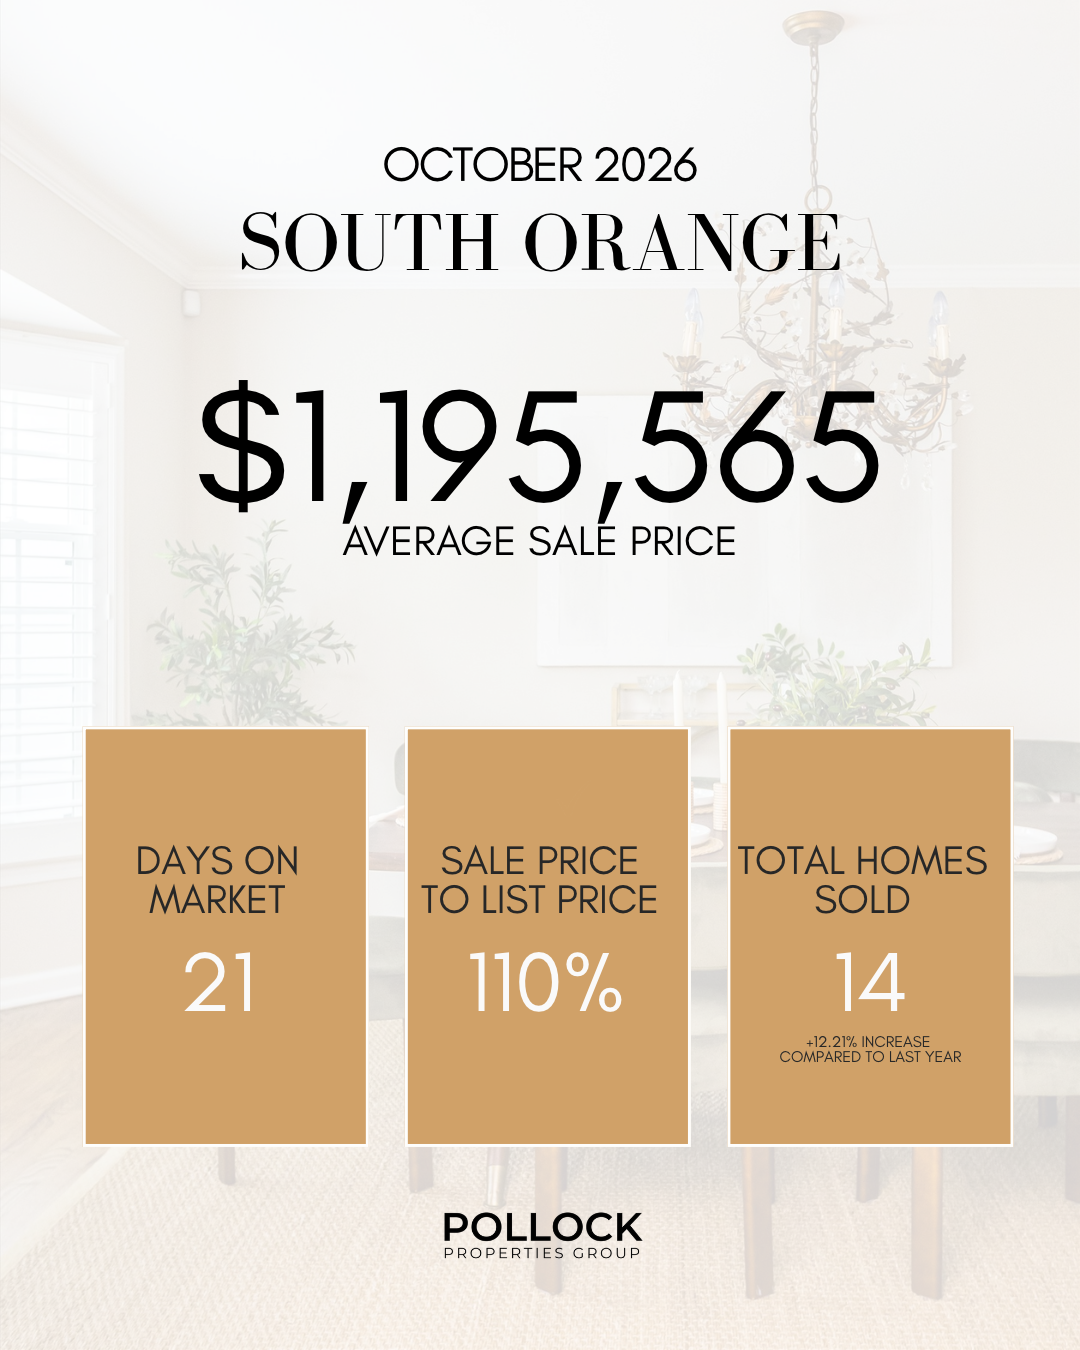
The average October sales price was $1,195,565, up from September’s $1,066,900. Homes sold for an average of 110.07% of list price and spent 21 days on the market.
October saw:
14 homes sold
25 homes go under contract
23 homes actively available for sale
Unlike Maplewood, South Orange actually experienced an increase in both closings and under-contract activity compared with September.
And while inventory declined slightly from 26 active listings to 23, buyers continued to have more choices than they did during the exceptionally tight summer months.
October also produced some extraordinary individual results.
One home sold for more than 145% of list price, while another sold for approximately 131% of asking.
At the same time, other properties sold below their asking prices, including one that closed at approximately 85% of list price.
That’s a remarkable range of outcomes within the same town and the same month.
And it reinforces something we’ve been saying all year.
The market doesn’t determine the outcome on its own. The individual home, its preparation, its pricing, and its presentation matter enormously.
Looking at the year-to-date numbers, South Orange continues to outperform 2025 in both prices and transaction volume.
Compared with last year:
Average sales prices are up 11.25%
The number of homes sold is up 12.21%
Under-contract activity is up 14.59%
The average sale-to-list price ratio is 113.29%
Through October, 147 homes have sold in South Orange, compared with 131 during the same period in 2025.
The year-to-date average sales price is now $1,160,746, compared with $1,043,372 last year.
Unlike Maplewood, where fewer homes have sold, South Orange has managed to produce more sales AND higher average prices throughout 2026.
That’s a very strong performance, particularly as the market moves into its traditionally quieter months.
What the October Numbers Really Told Us
October reinforced something we’ve been watching since the summer.
We’re no longer in the spring market so we shouldn’t be using spring market expectations to make fall market decisions.
During the height of the spring selling season, homes were routinely receiving multiple offers, buyers were competing aggressively, and exceptionally prepared properties were achieving extraordinary premiums.
That environment has changed.
There are fewer buyers actively competing for homes. Some properties are taking longer to sell. And buyers appear increasingly willing to negotiate or walk away when a home doesn’t meet their expectations.
But that doesn’t mean demand has disappeared.
In October, homes still sold for an average of approximately 109% of asking in Maplewood and 110% in South Orange.
Those are still very strong results.
What we’re seeing is a market that has become much more selective.
The homes that are beautifully prepared, thoughtfully priced, and effectively marketed can still generate remarkable competition.
The homes that aren’t are much more vulnerable to extended market time, price reductions, and negotiation.
Preparation matters. Pricing matters. Presentation matters. And strategy matters more than ever.
One Market. Two Different Stories.
One of the most interesting things about 2026 continues to be the difference between Maplewood and South Orange.
In Maplewood, year-to-date average sales prices have increased more than 21%, even though nearly 11% fewer homes have sold.
In South Orange, average prices have increased more than 11%, while the number of sales has increased more than 12%.
Those are two very different market experiences.
And even within each town, individual homes are producing dramatically different results.
That’s why we believe hyper-local expertise matters so much.
A national real estate headline can’t tell you what’s happening in Maplewood or South Orange.
And even a report about Essex County may not accurately reflect what’s happening on your particular street.
Real estate is local. Sometimes it’s even house by house.
Our Perspective: Care • Serve • Give
At Pollock Properties Group, we believe market reports should do more than share statistics. They should help people make confident decisions.
Our Care • Serve • Give philosophy shapes every conversation we have with our clients. We care by helping people understand what the numbers actually mean. We serve by bringing strategy, preparation, negotiation, and hyper-local expertise to every transaction. And we give by investing back into the communities that make Maplewood, South Orange, and the surrounding towns such extraordinary places to call home.
Because buying or selling a home has never been just about the market.
It’s about people. It’s about families beginning a new chapter. It’s about helping people, all people, arrive home.
Looking Ahead: What Will the Final Months of 2026 Tell Us?
As we move into November and December, we’re watching the market especially closely.
The number of homes going under contract has slowed considerably from the spring, and we’re seeing buyers approach their decisions with greater caution.
But we also know that the buyers who remain active this time of year are often highly motivated.
For sellers, that creates opportunity, but it also means we need to be especially thoughtful about preparation, pricing, and timing.
A home that might have attracted ten offers in April may not receive that same response in November.
That doesn’t mean it can’t sell exceptionally well. It means the strategy needs to reflect the market we’re actually in.
For buyers, this may be one of the more interesting times of the year.
Less competition can create opportunities to negotiate, conduct thorough due diligence, and make decisions without the extraordinary pressure of the spring market.
And for homeowners thinking about selling in 2027, now is the time to begin preparing.
We’ve seen what thoughtful preparation can accomplish. We’ve also seen the difference between homes that enter the market fully ready and those that don’t.
The work we do now can make an enormous difference when the next spring selling season arrives.
And one question remains at the center of our analysis:
Will the extraordinary price growth we’ve experienced in 2026 continue into 2027, or are we beginning to see the market settle into a more sustainable rhythm?
We don’t know yet.
But we’ll continue tracking the numbers, studying buyer behavior, and sharing what we’re seeing so that you can make informed decisions with confidence.
Because the goal isn’t simply to know what the market did last month.
It’s to understand what those numbers mean for the decisions you’ll make next.
Curious about your town?
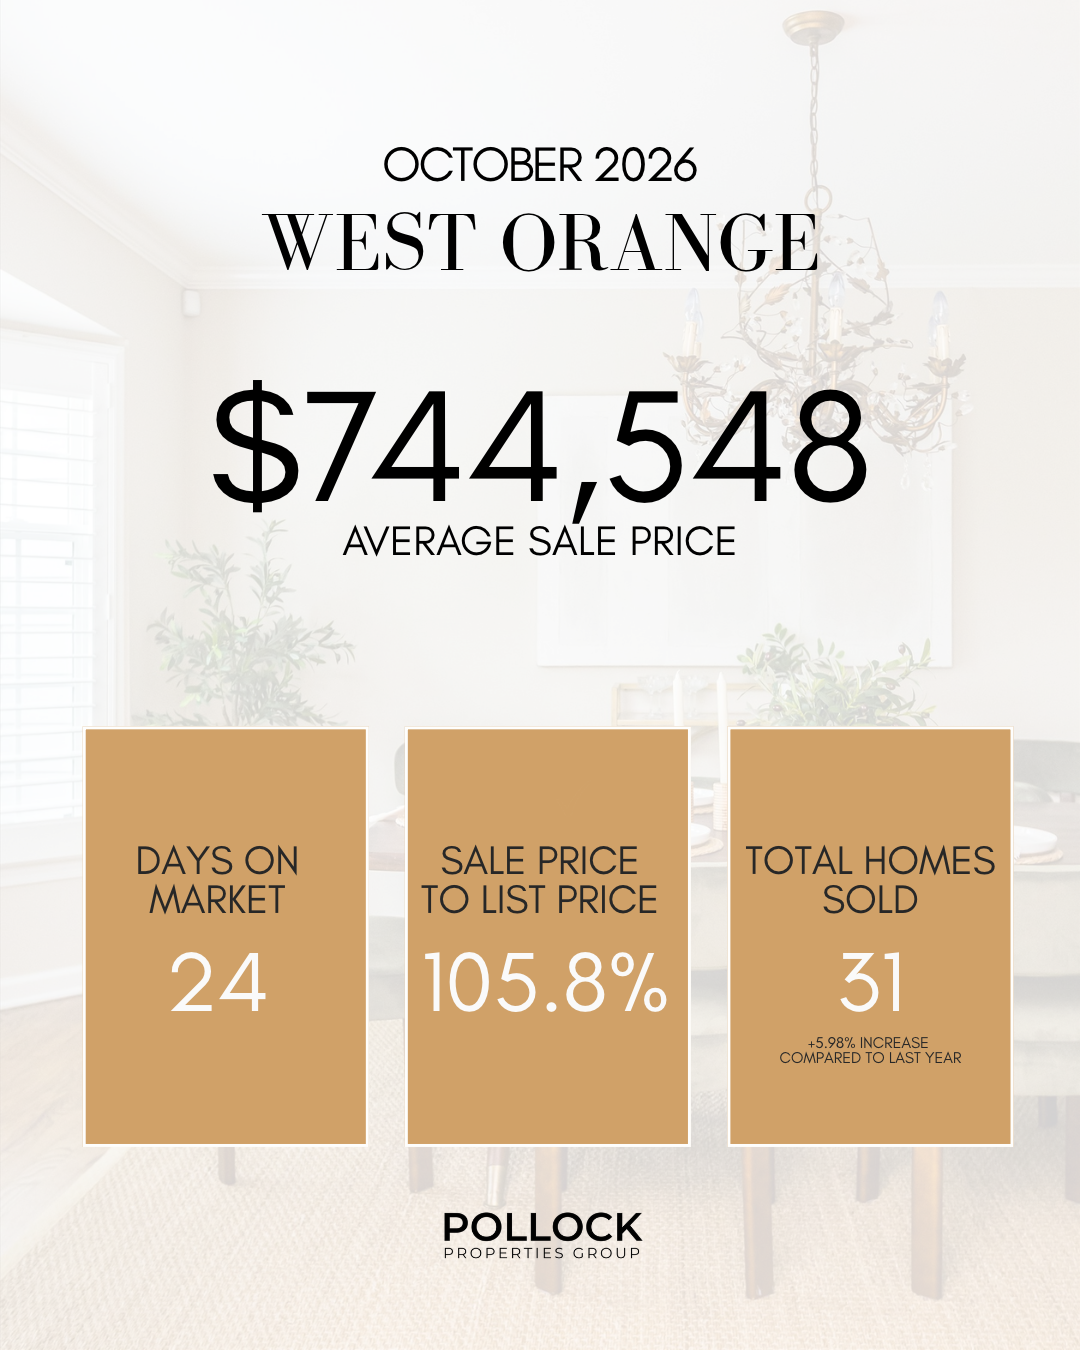
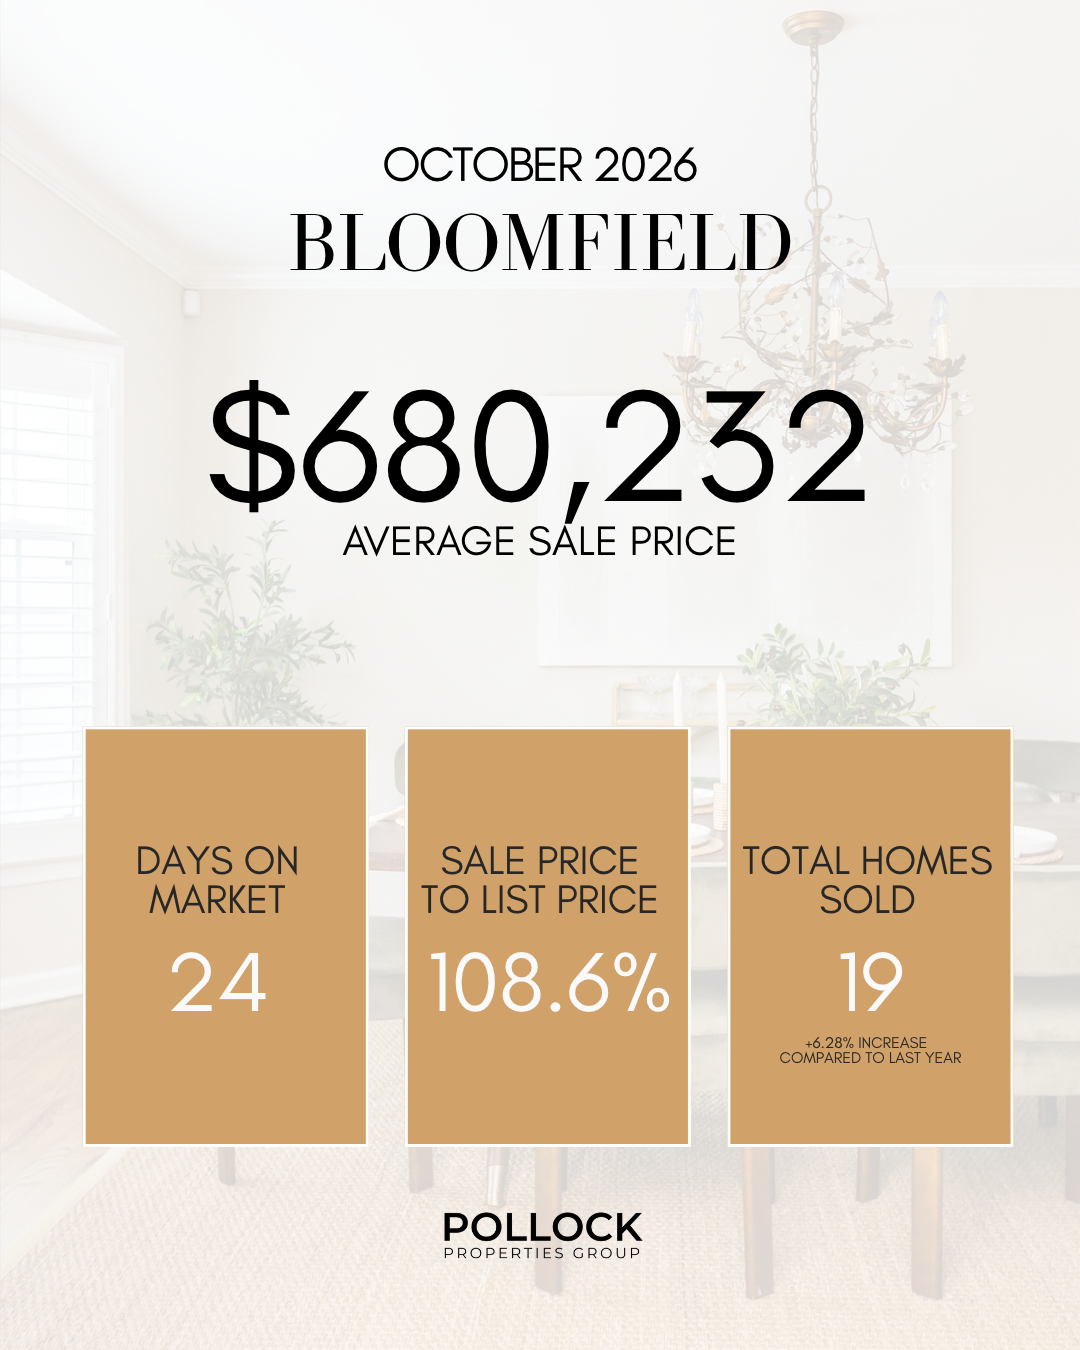
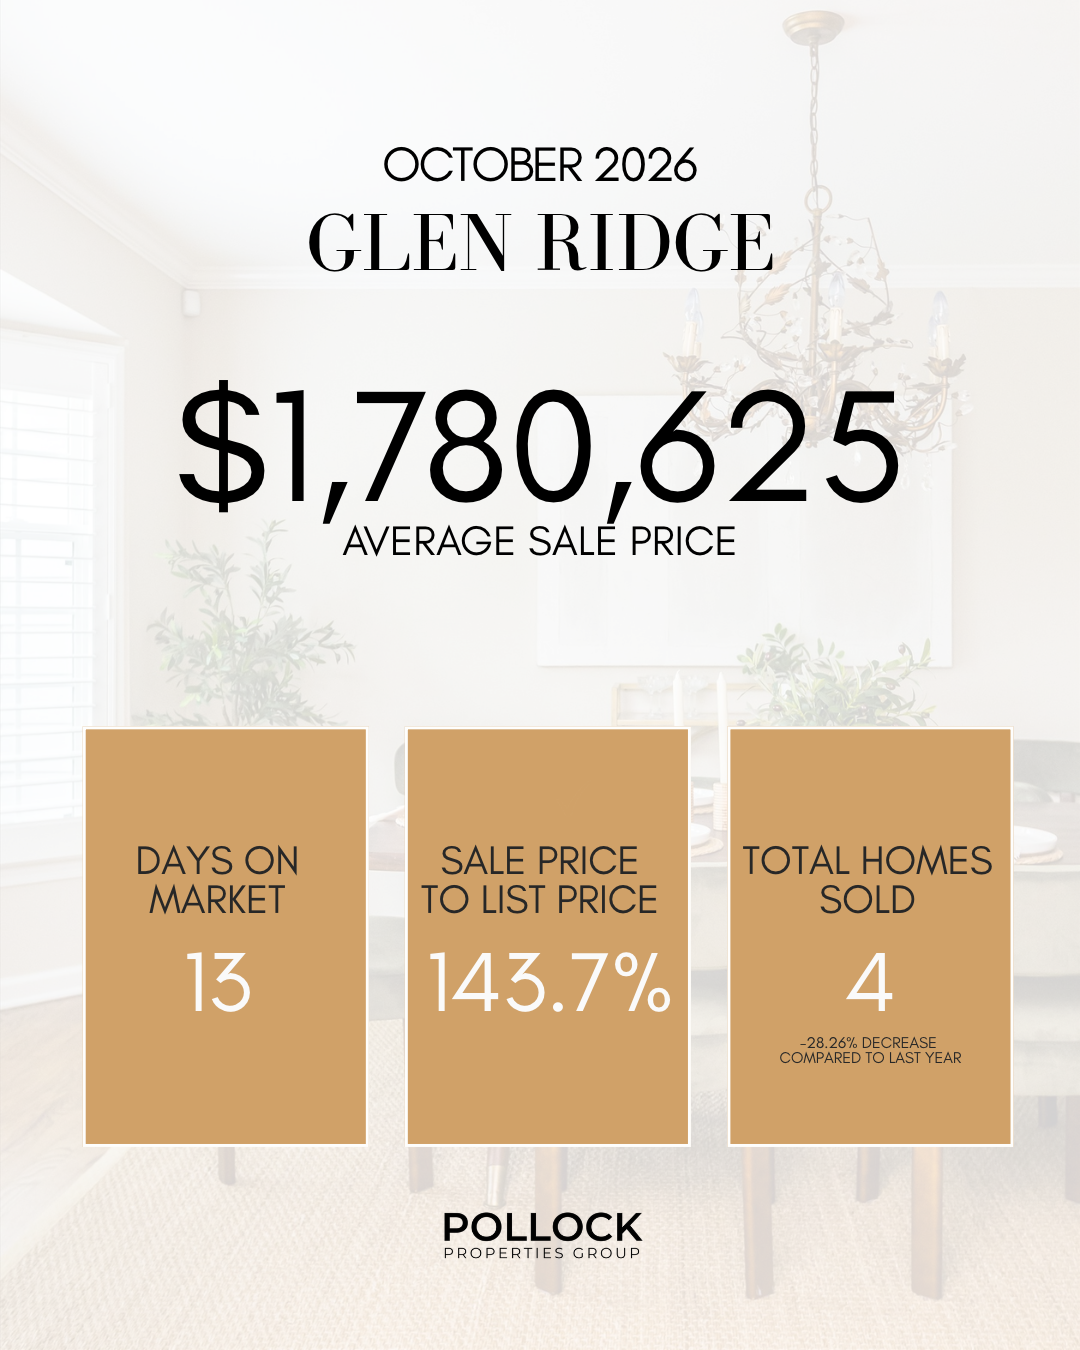
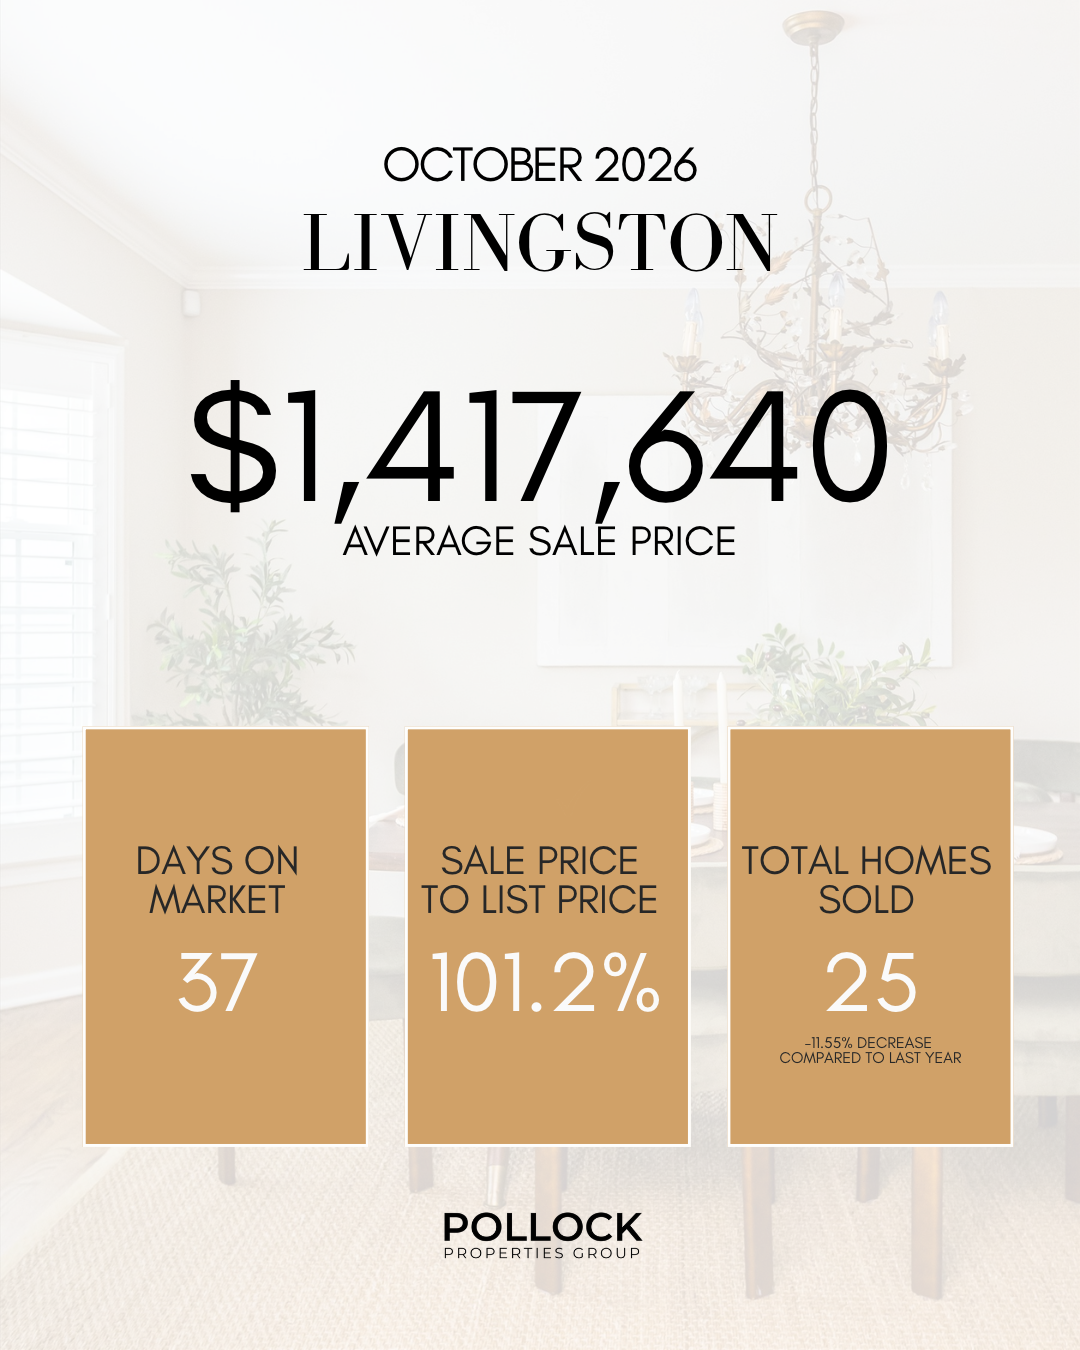
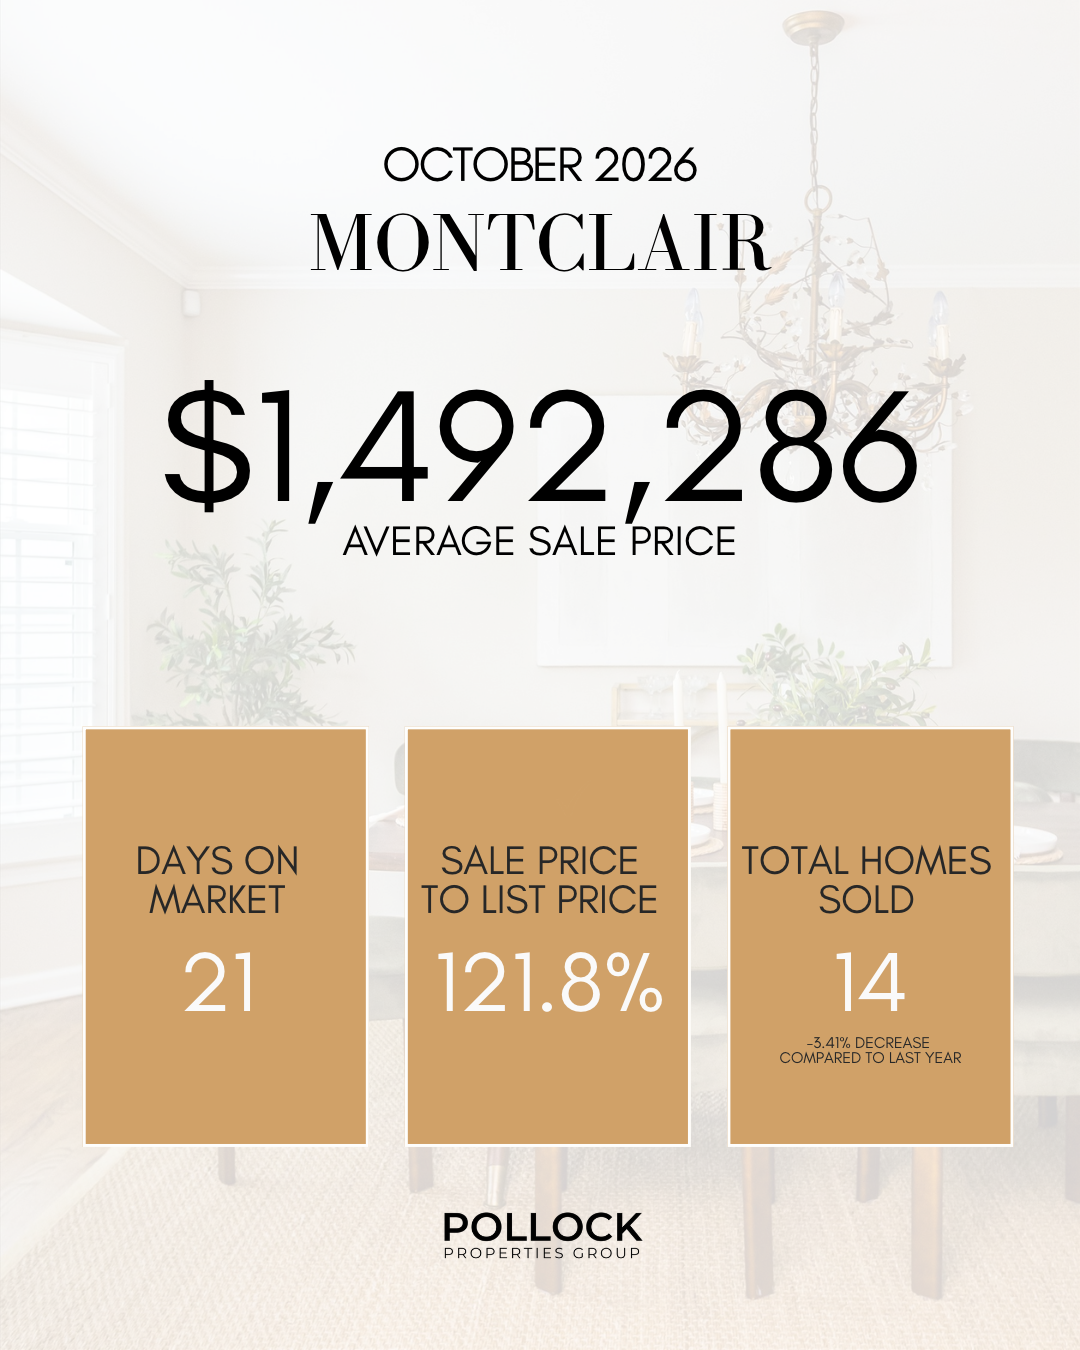
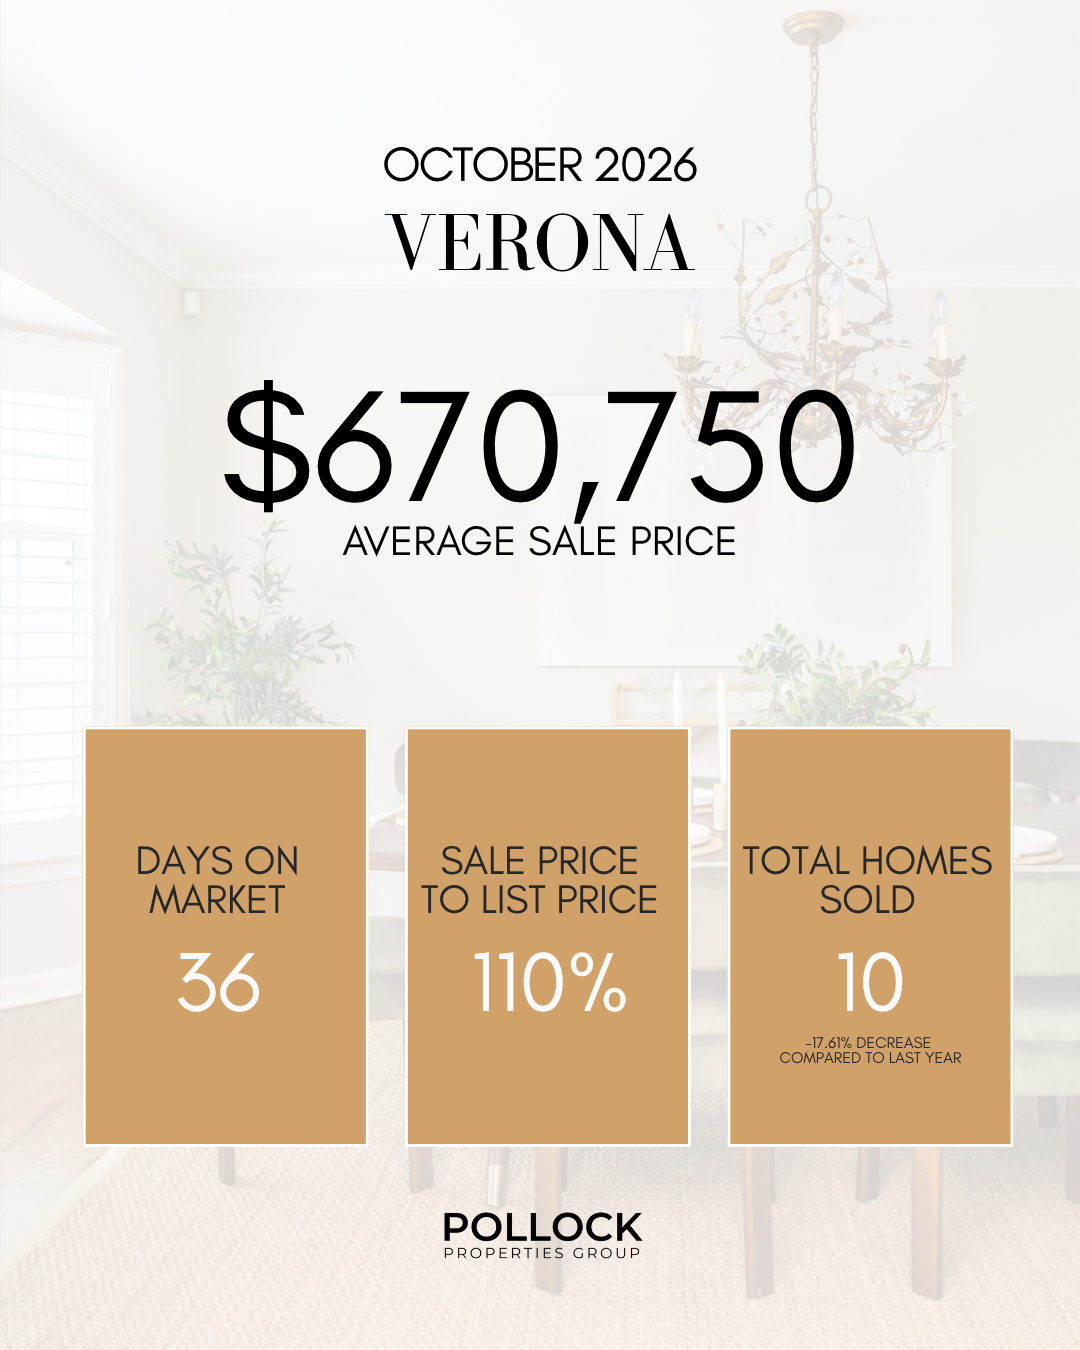
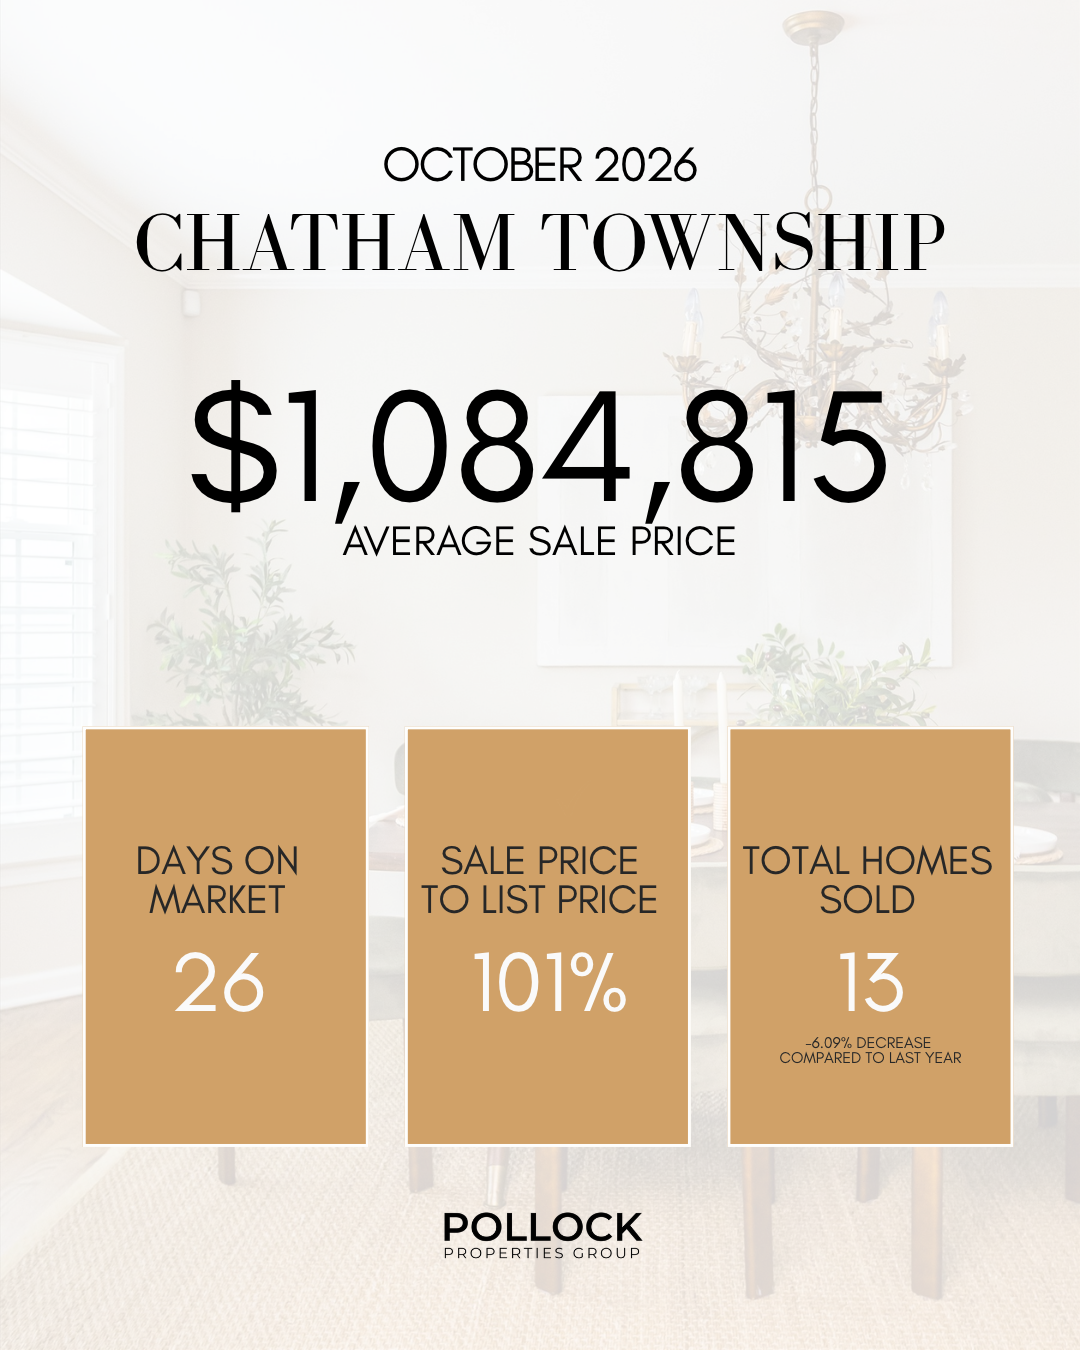
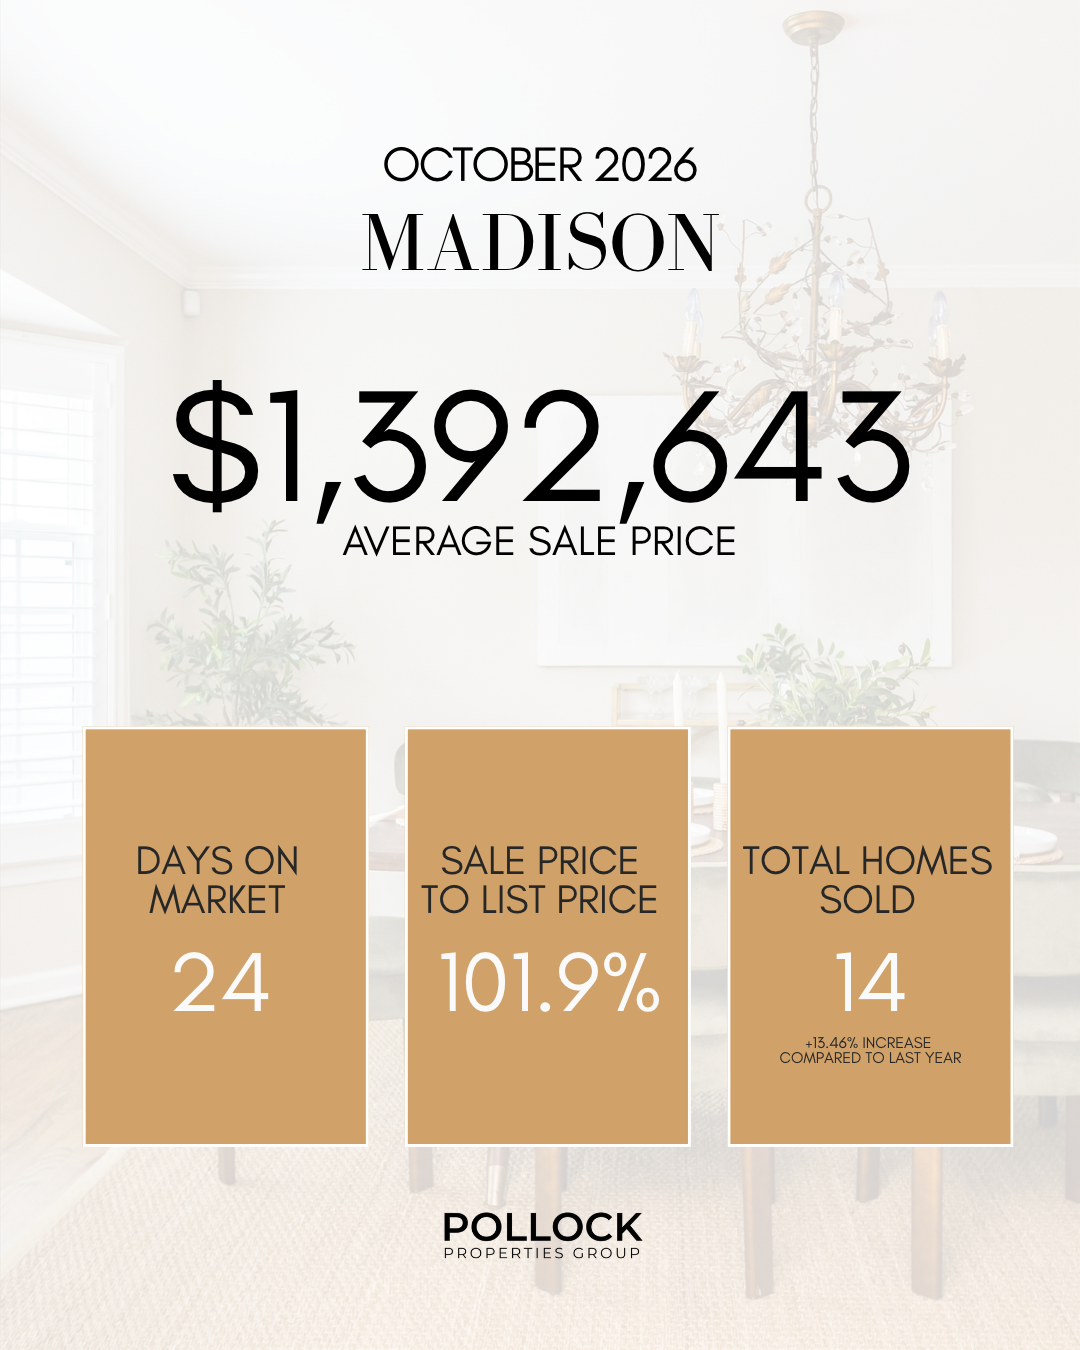
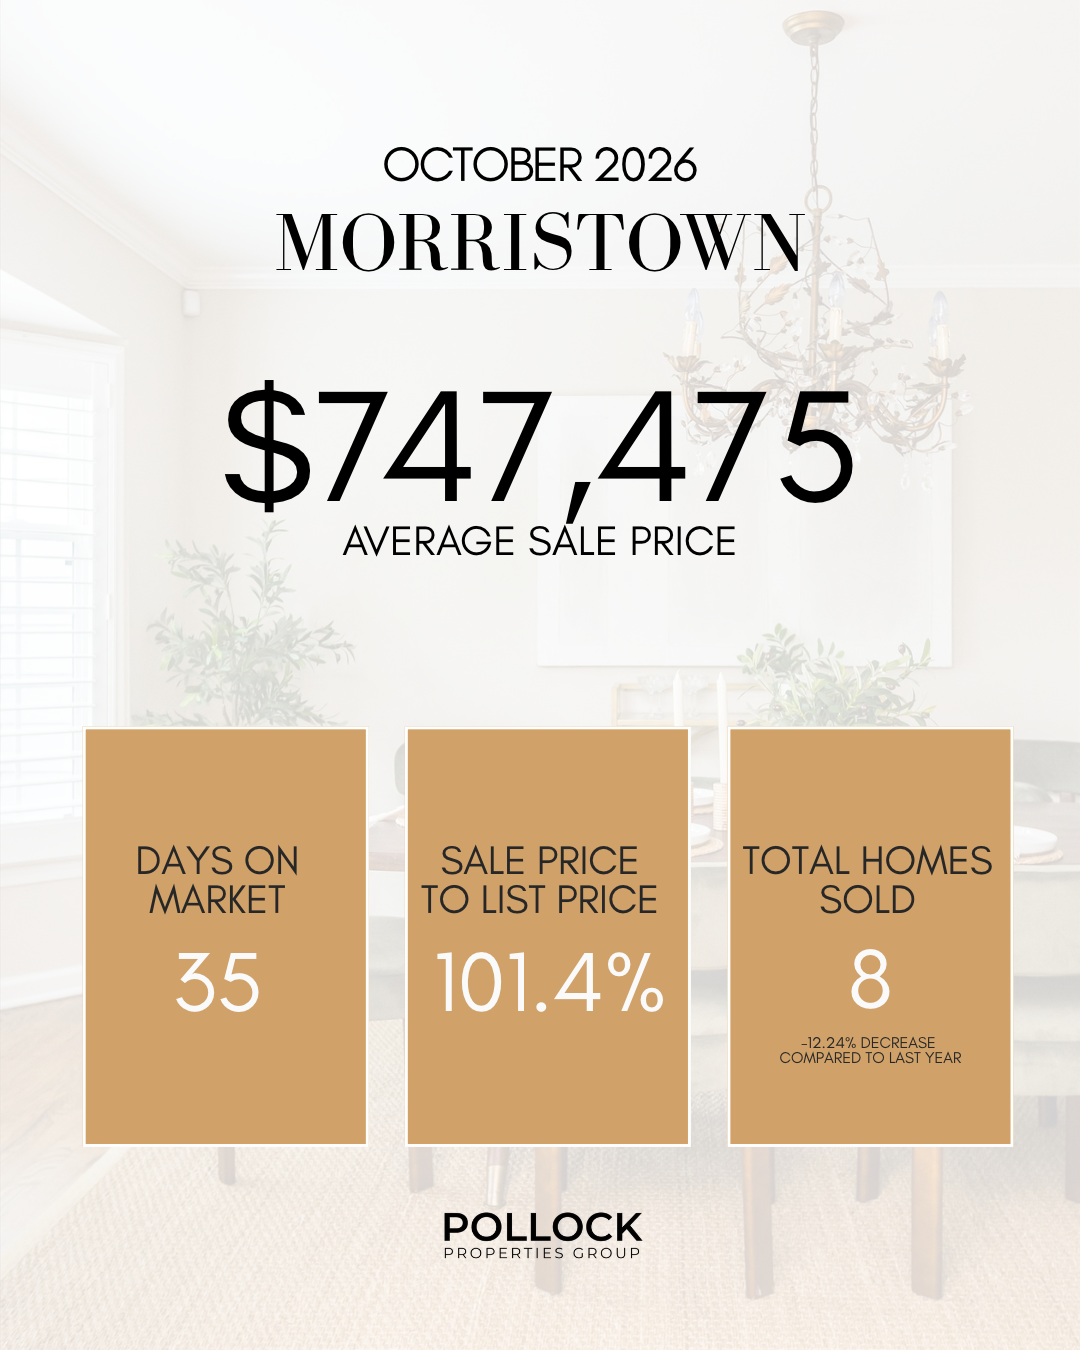
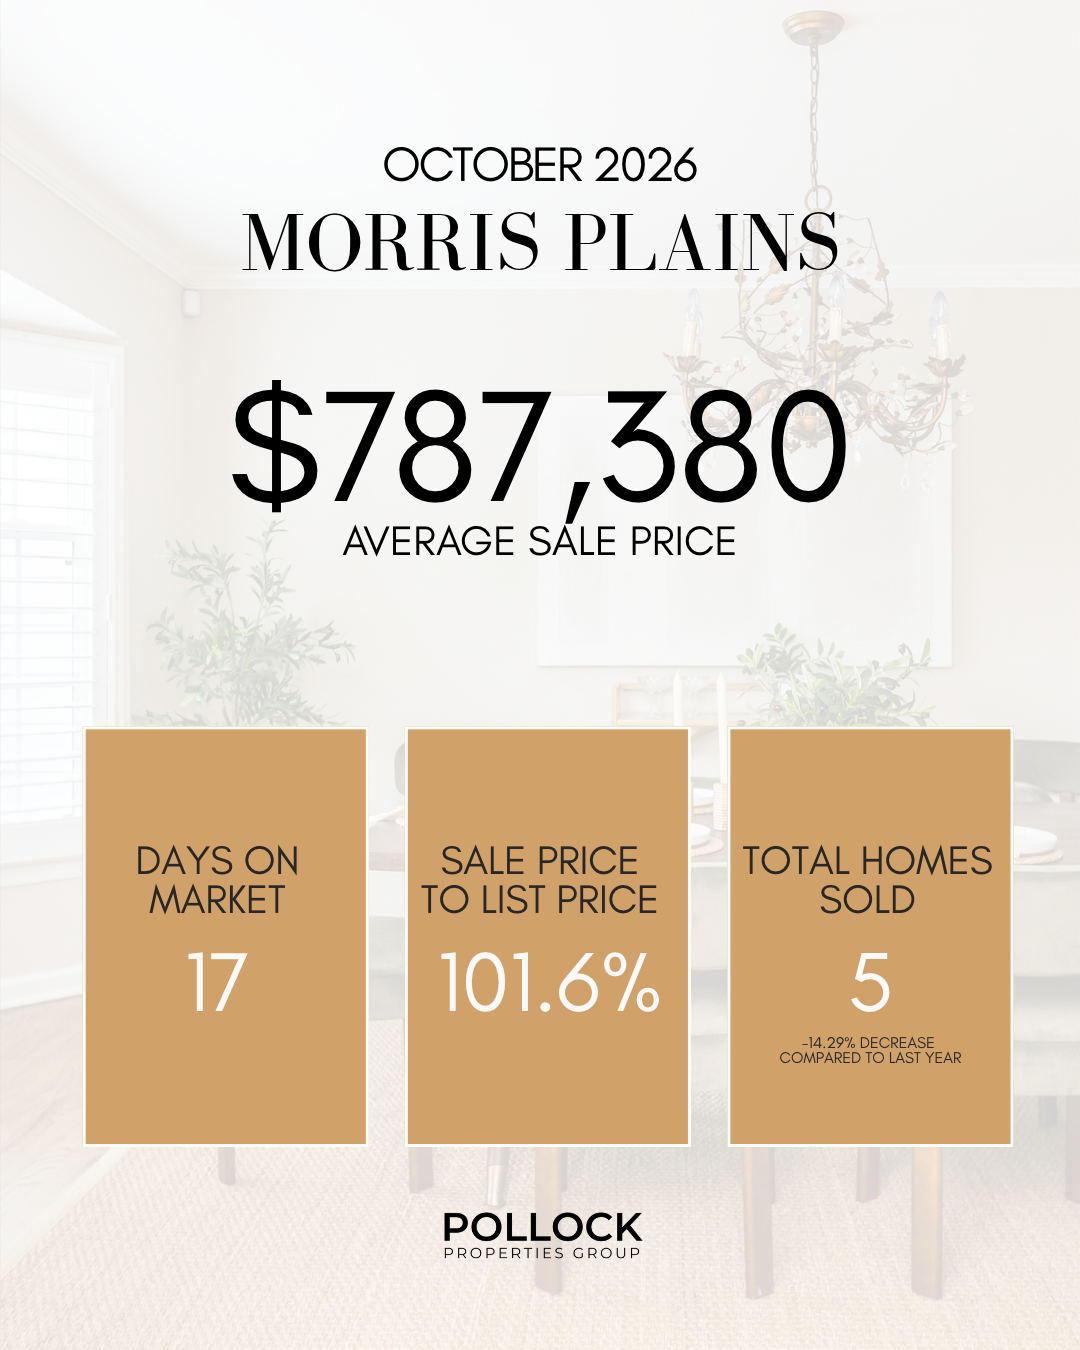
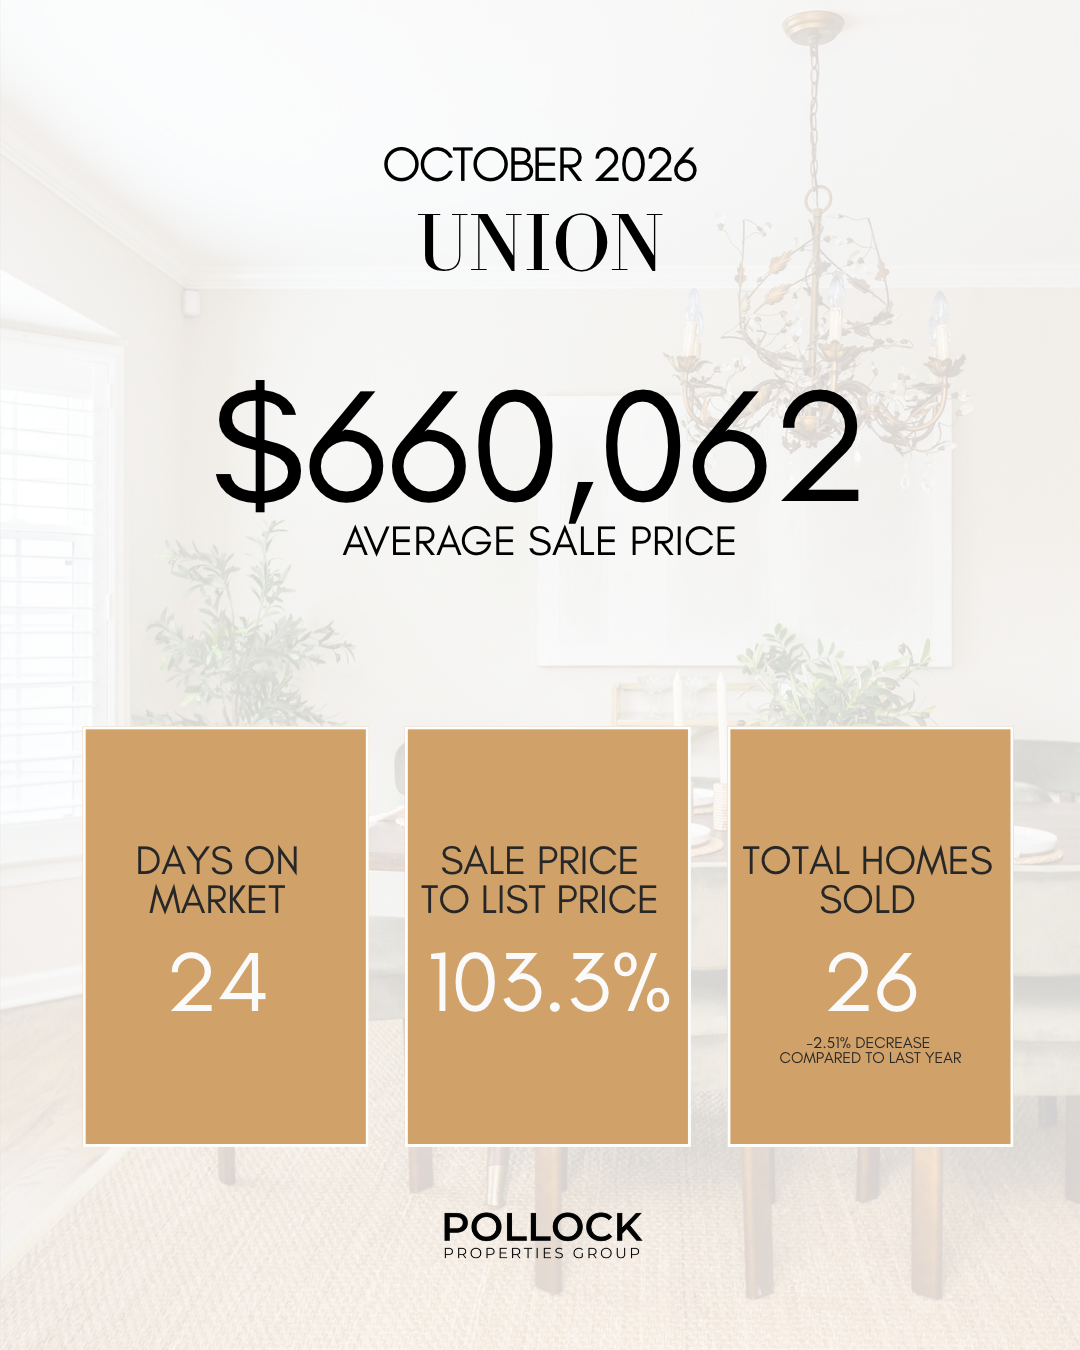
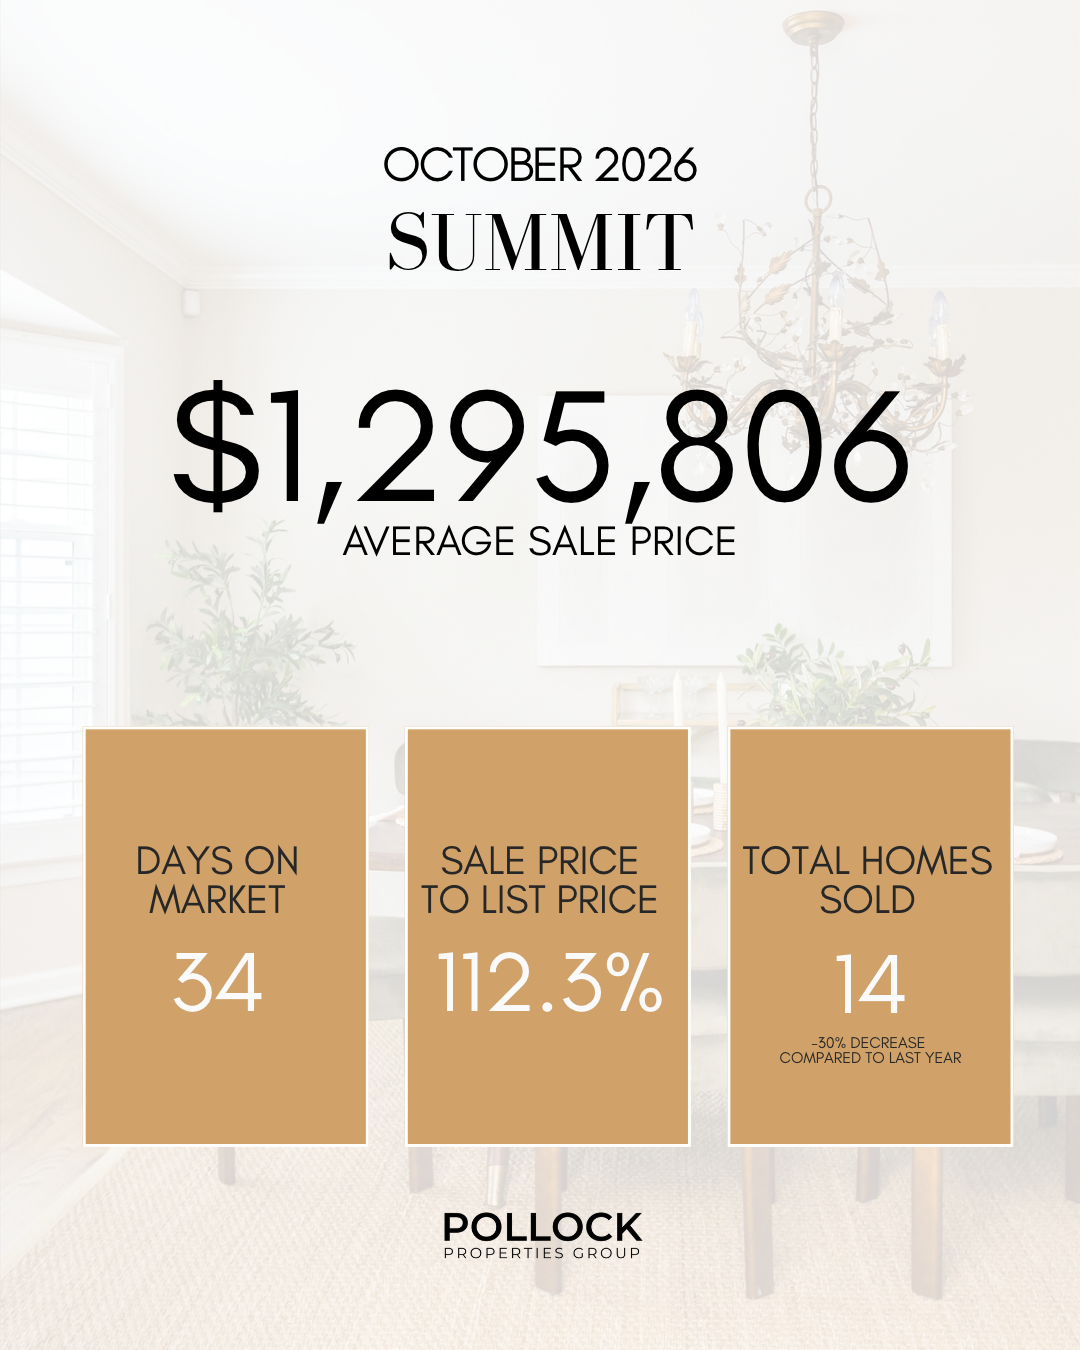
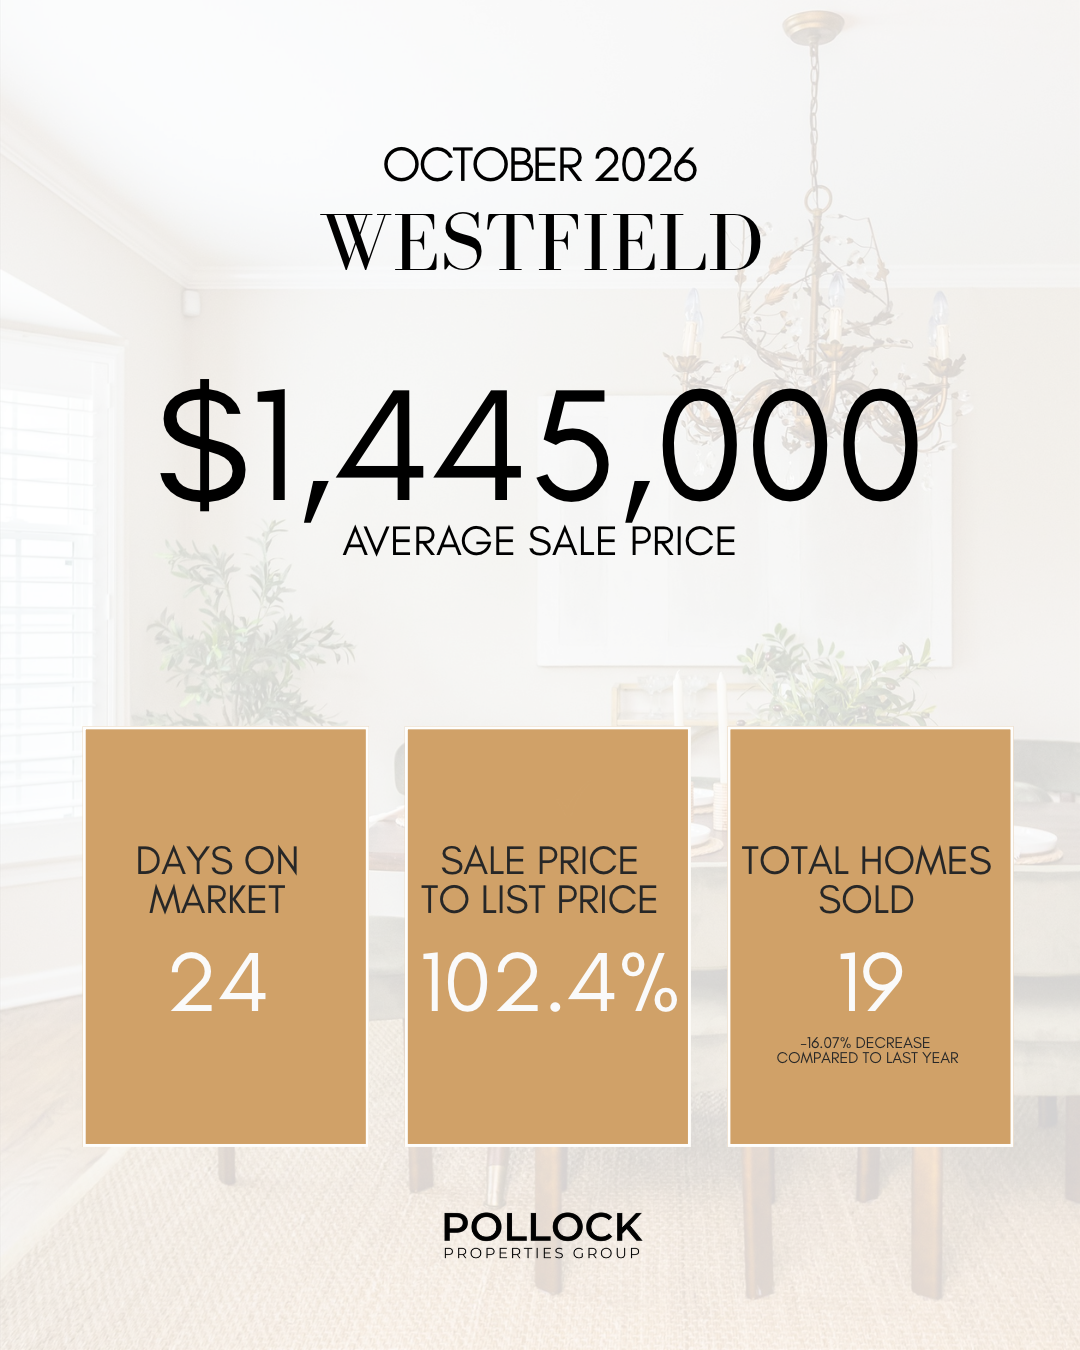
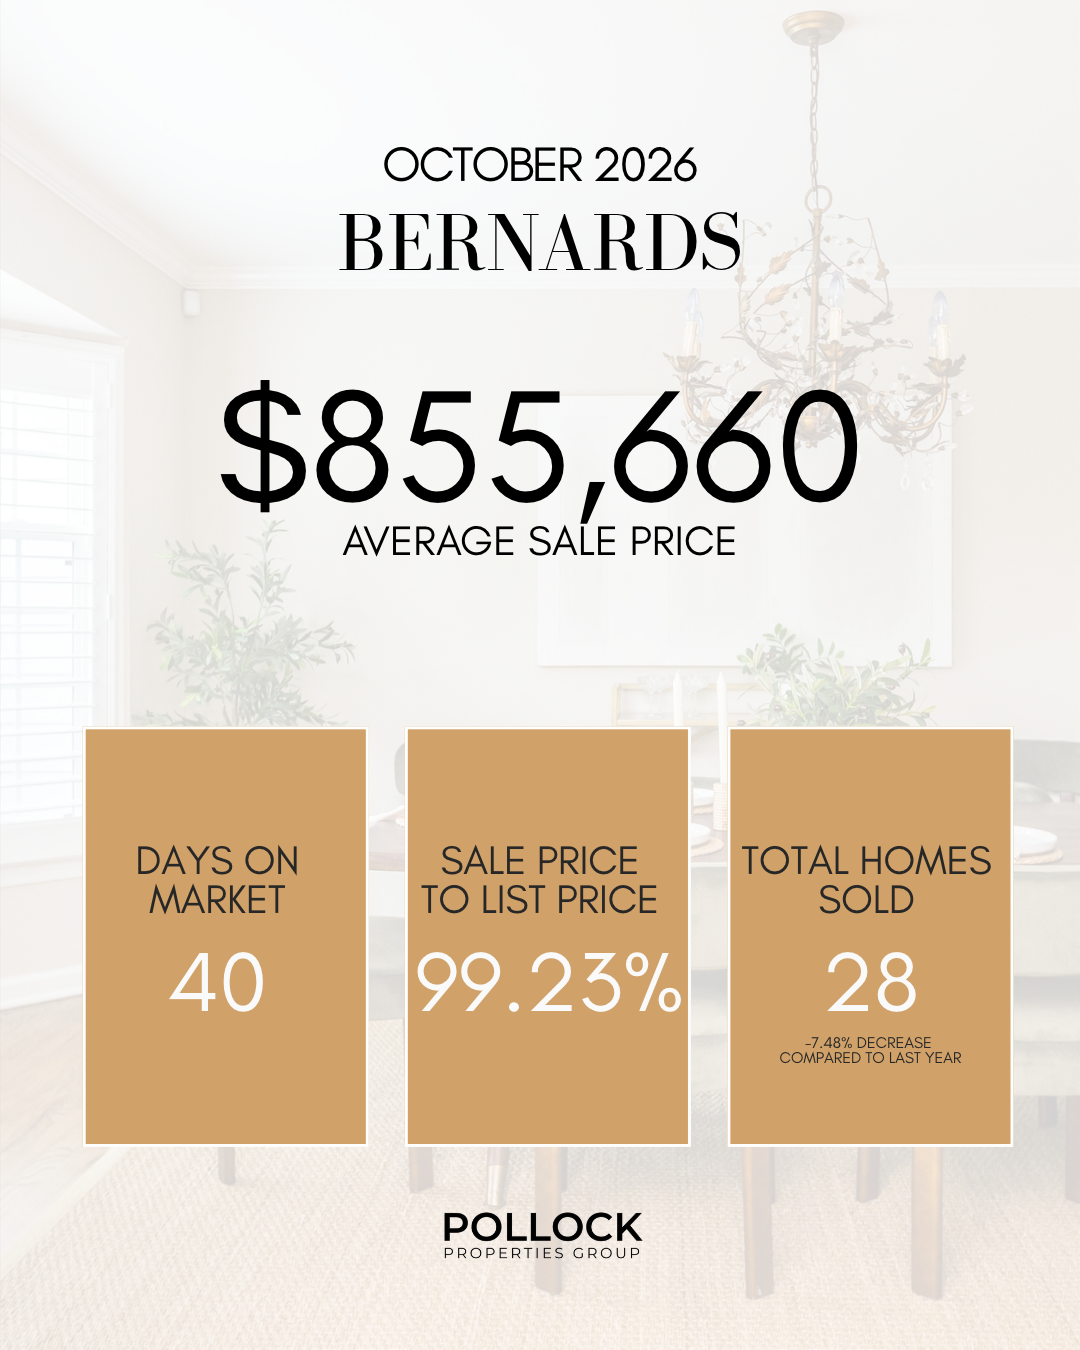
While these reports focus on Maplewood and South Orange, we prepare the same thoughtful market analysis for communities throughout Northern New Jersey. Whether you’re interested in West Orange, Millburn, Livingston, Montclair, Cranford, Westfield, or another nearby town, we’d be happy to share what the market is doing and what it means for your home.
Just reach out.
Source: Garden State Multiple Listing Service, October 2026 market reports for Maplewood and South Orange. Monthly figures and year-to-date comparisons and average sales prices can be influenced by the mix of homes sold in any given month.
***Note: CLICK FOR FULL REPORT FOR EACH TOWN
Additional Essex County Towns
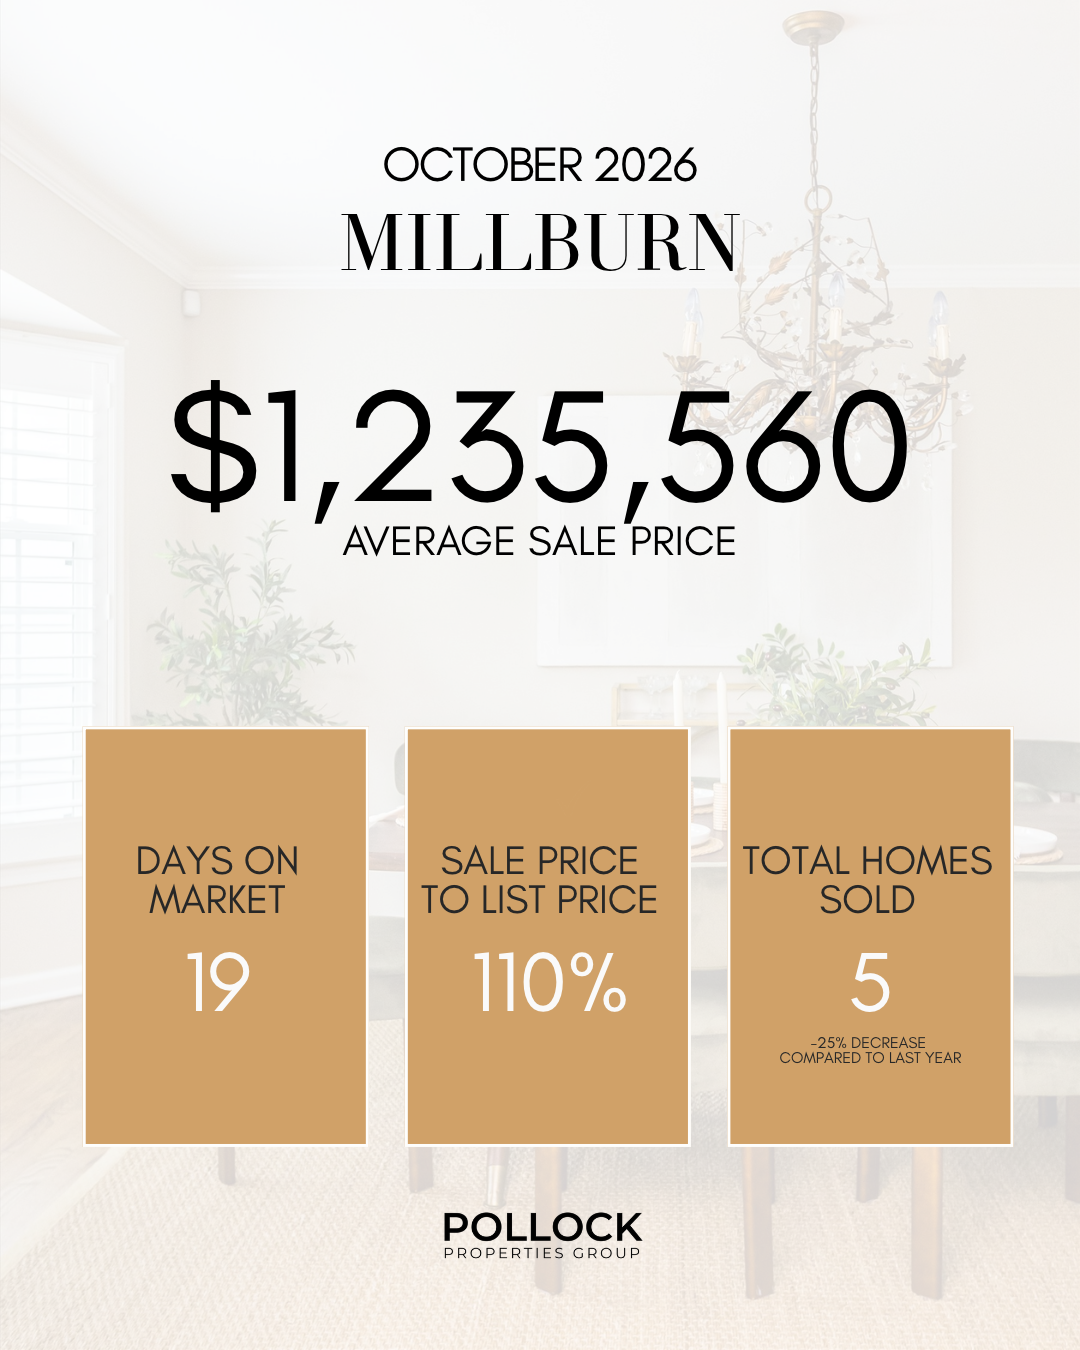
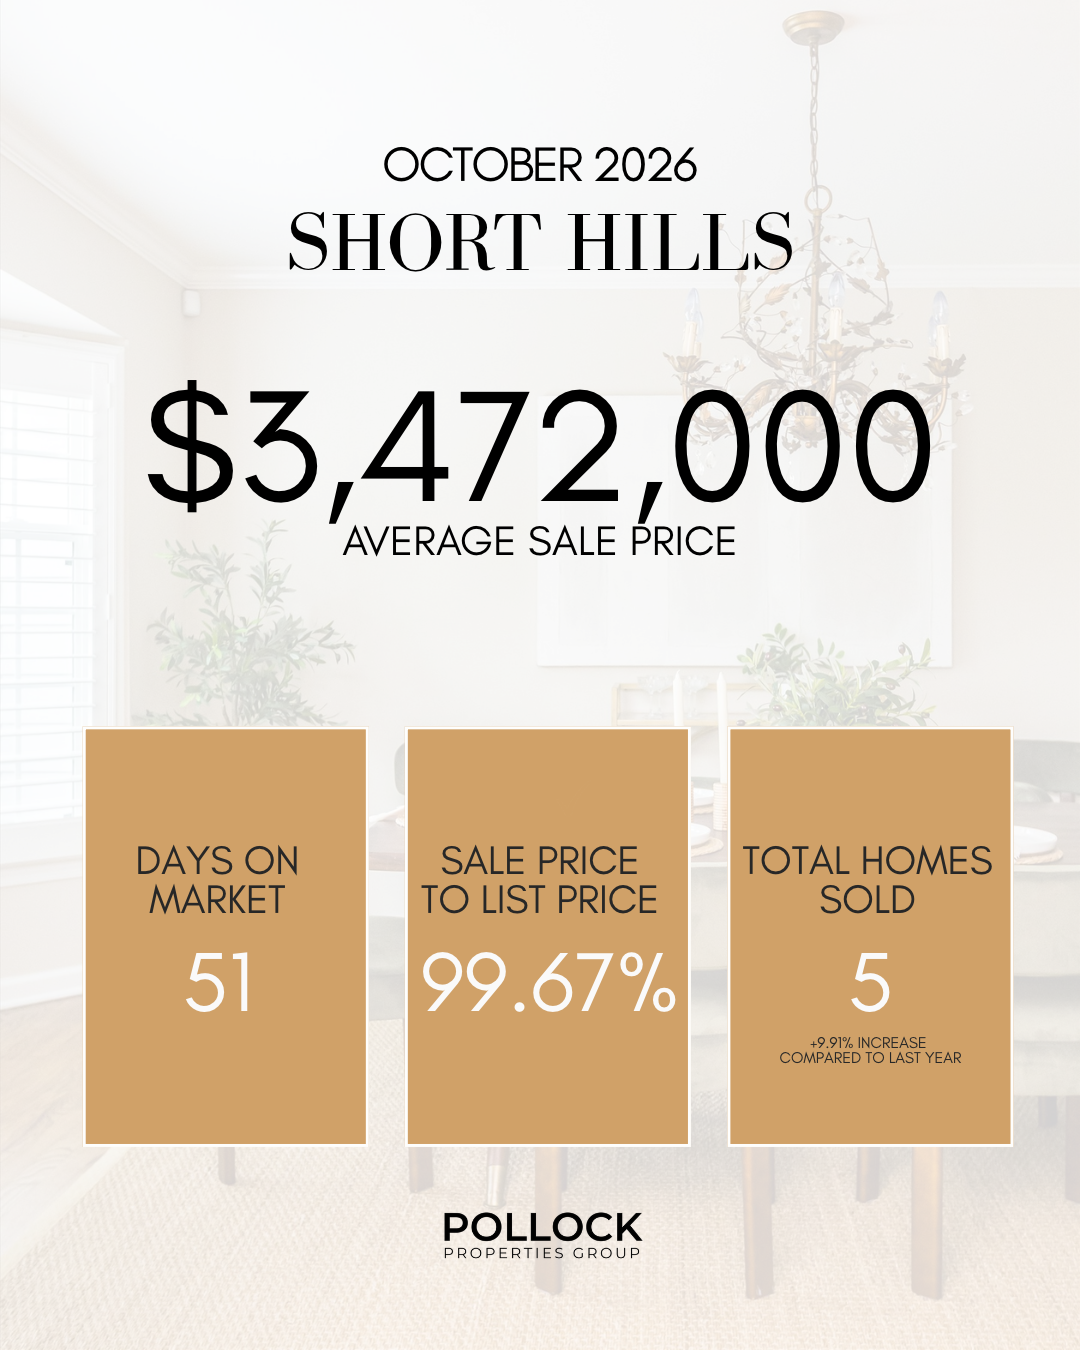
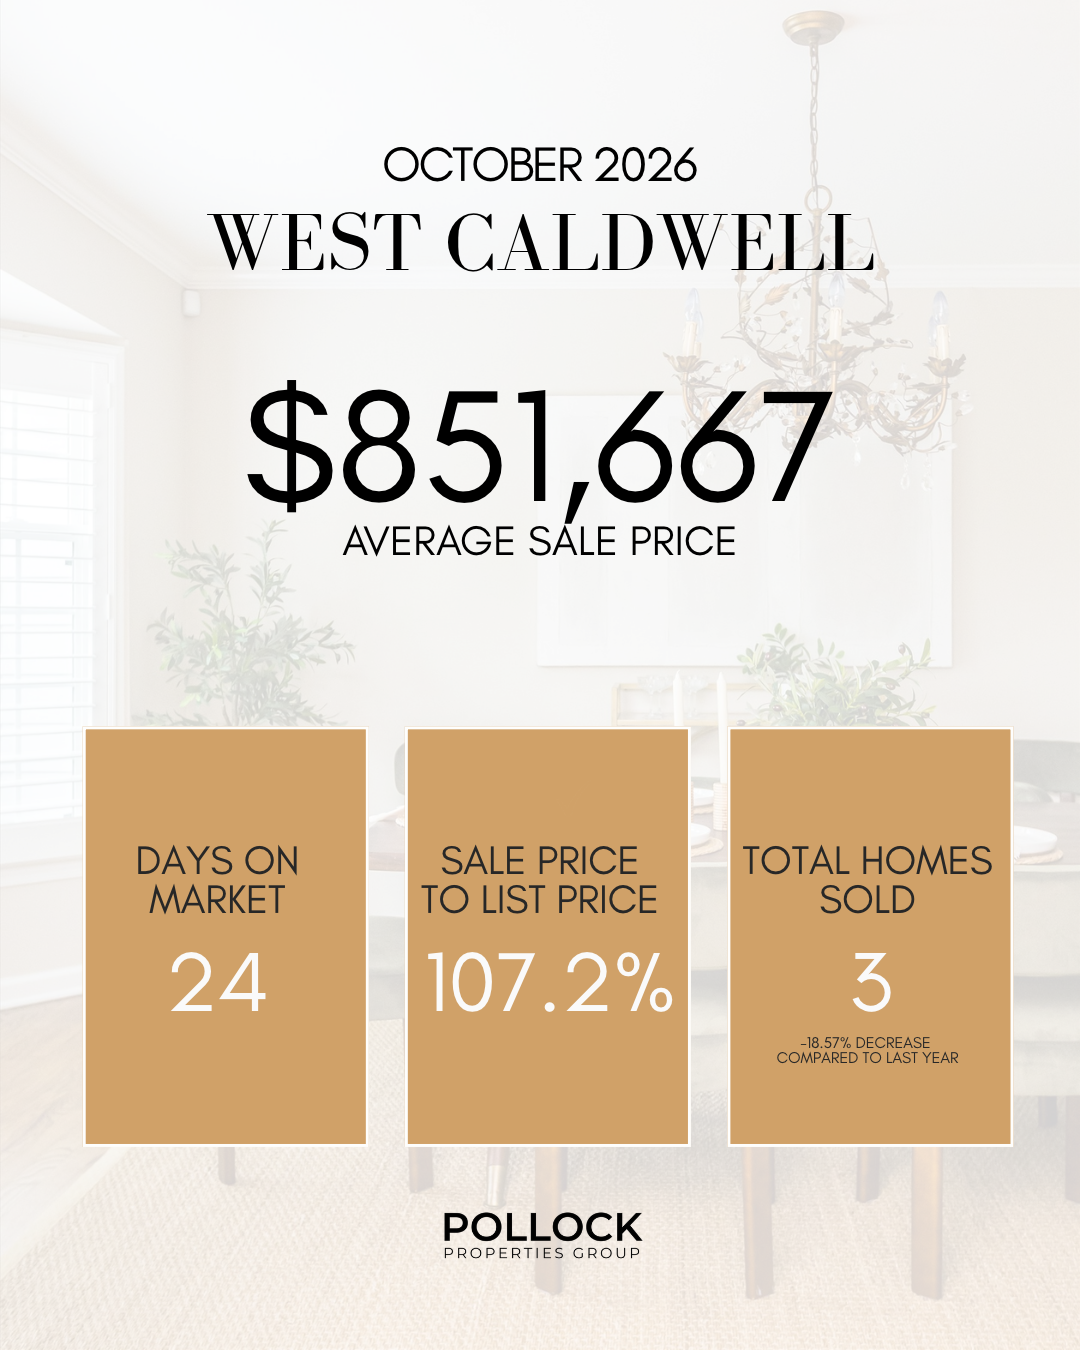
Morris County Towns
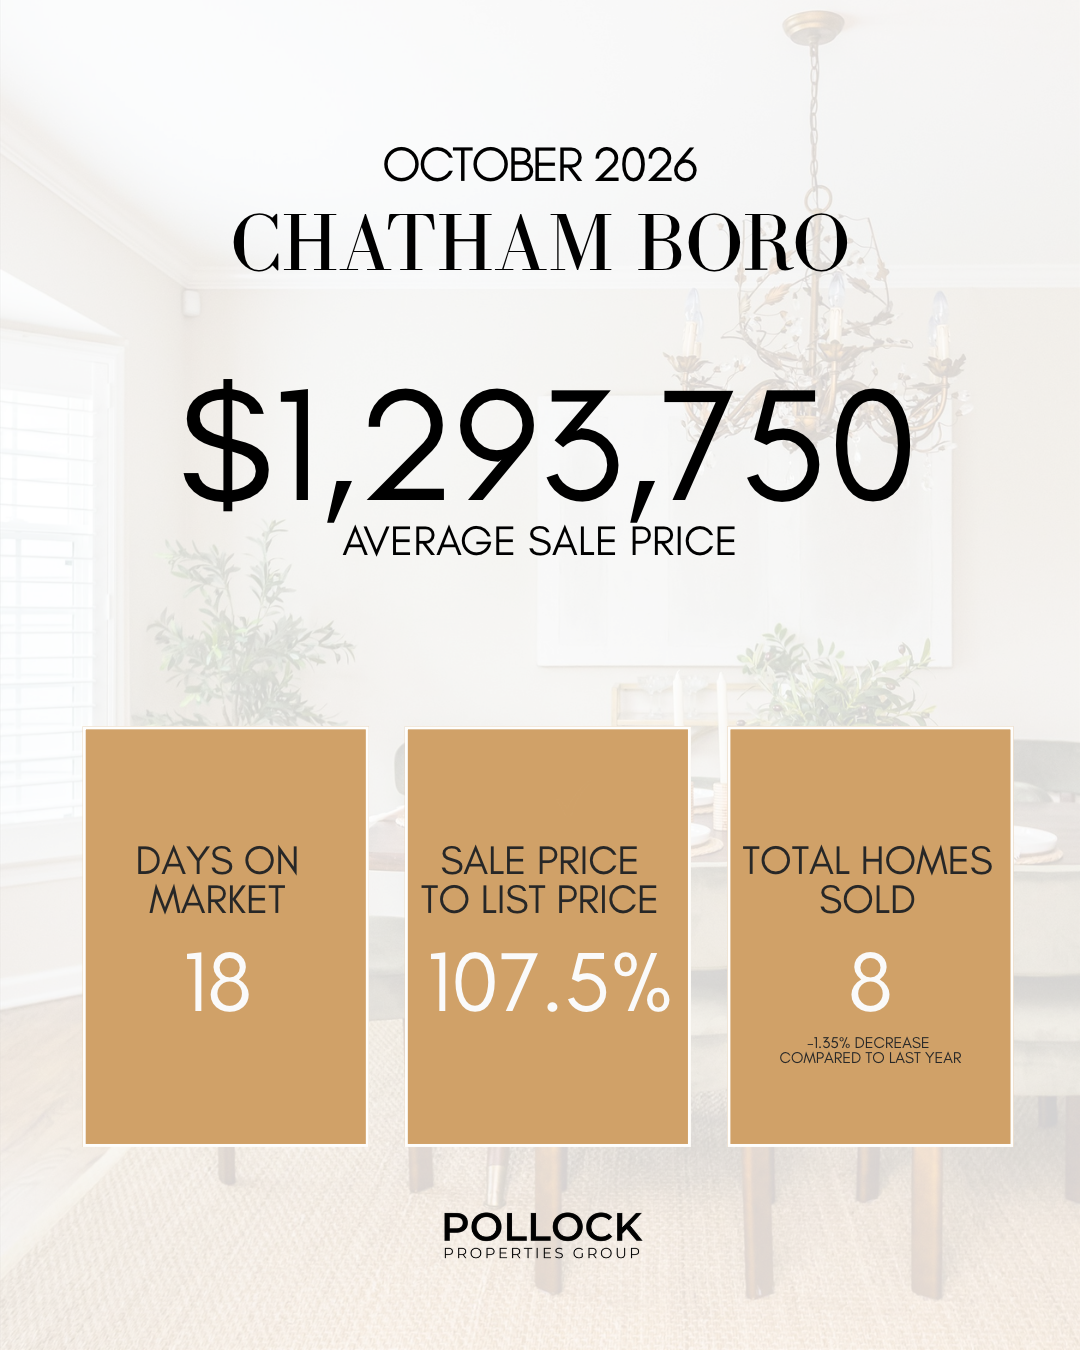
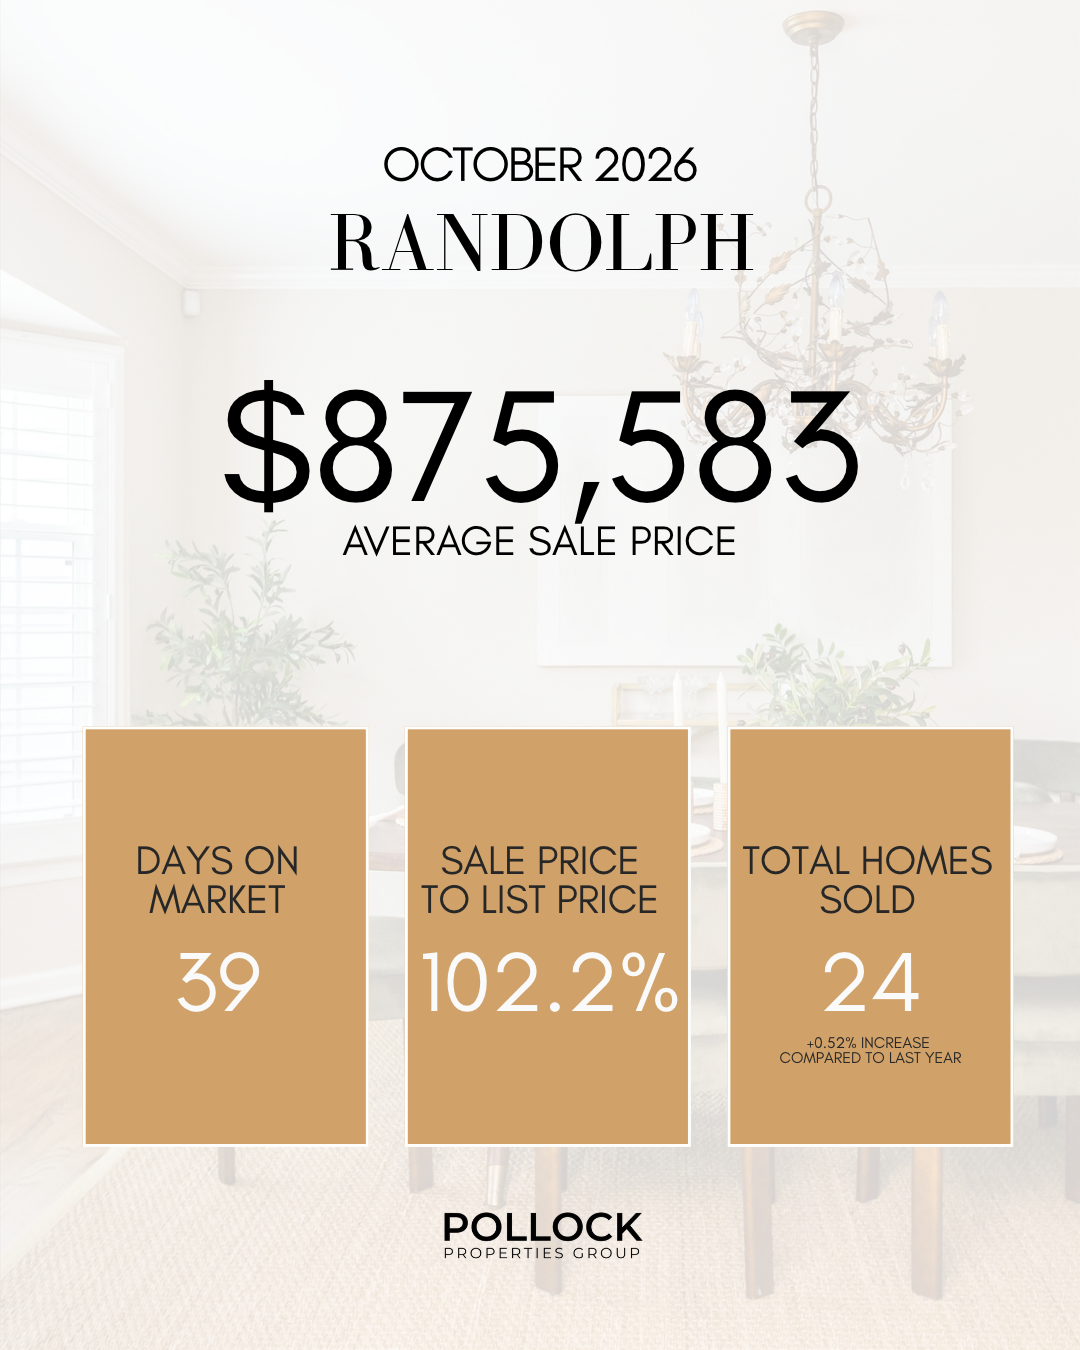
Union County Towns
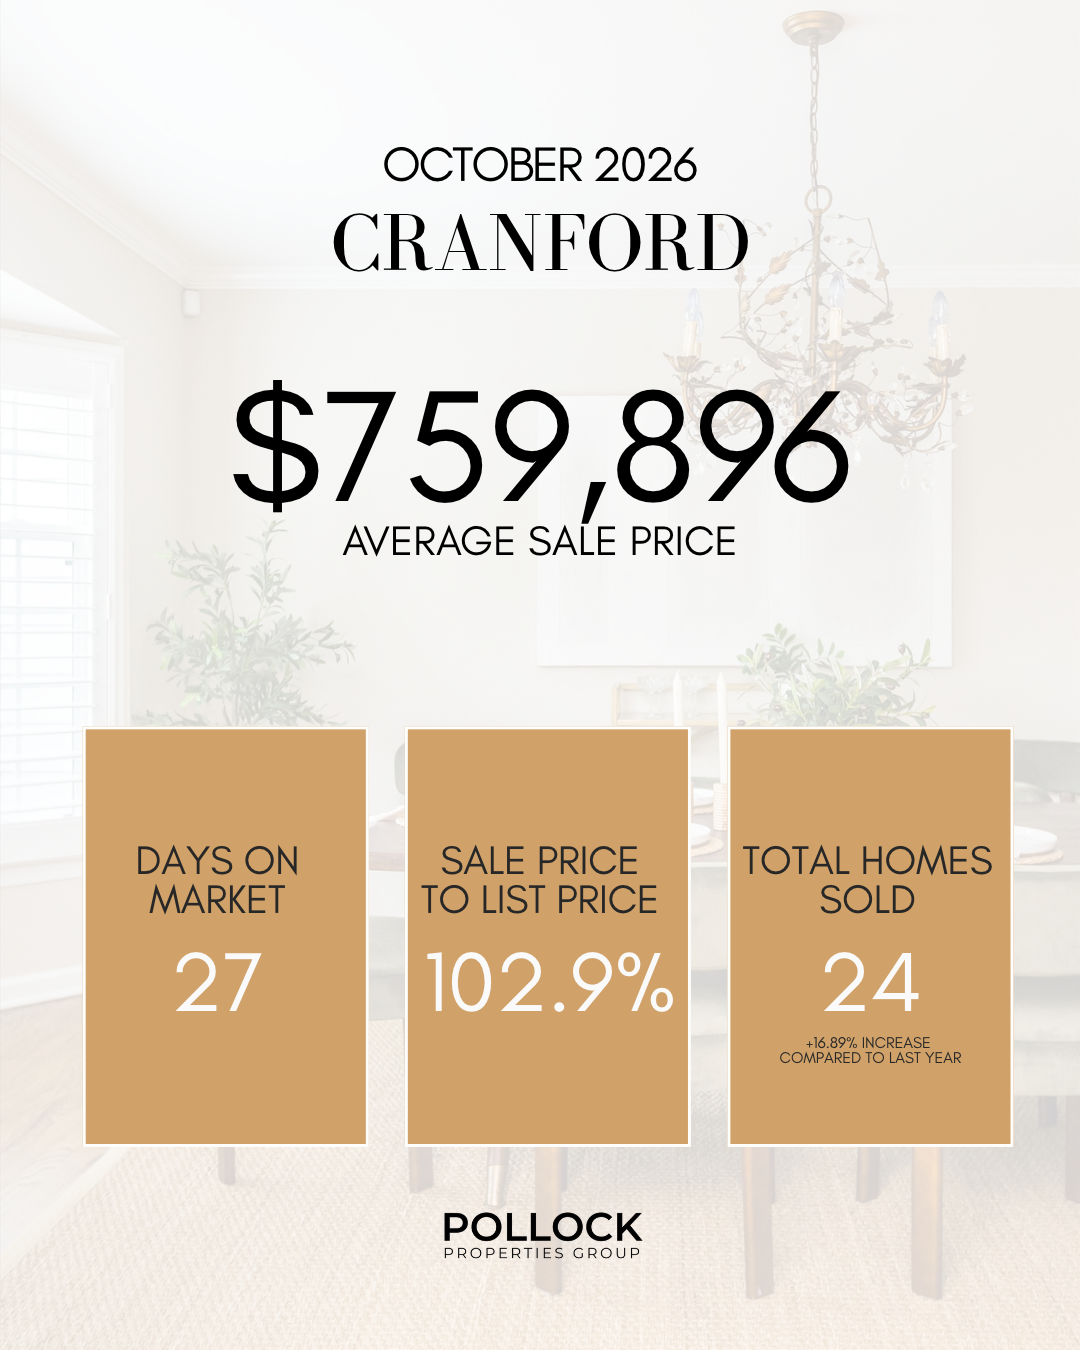
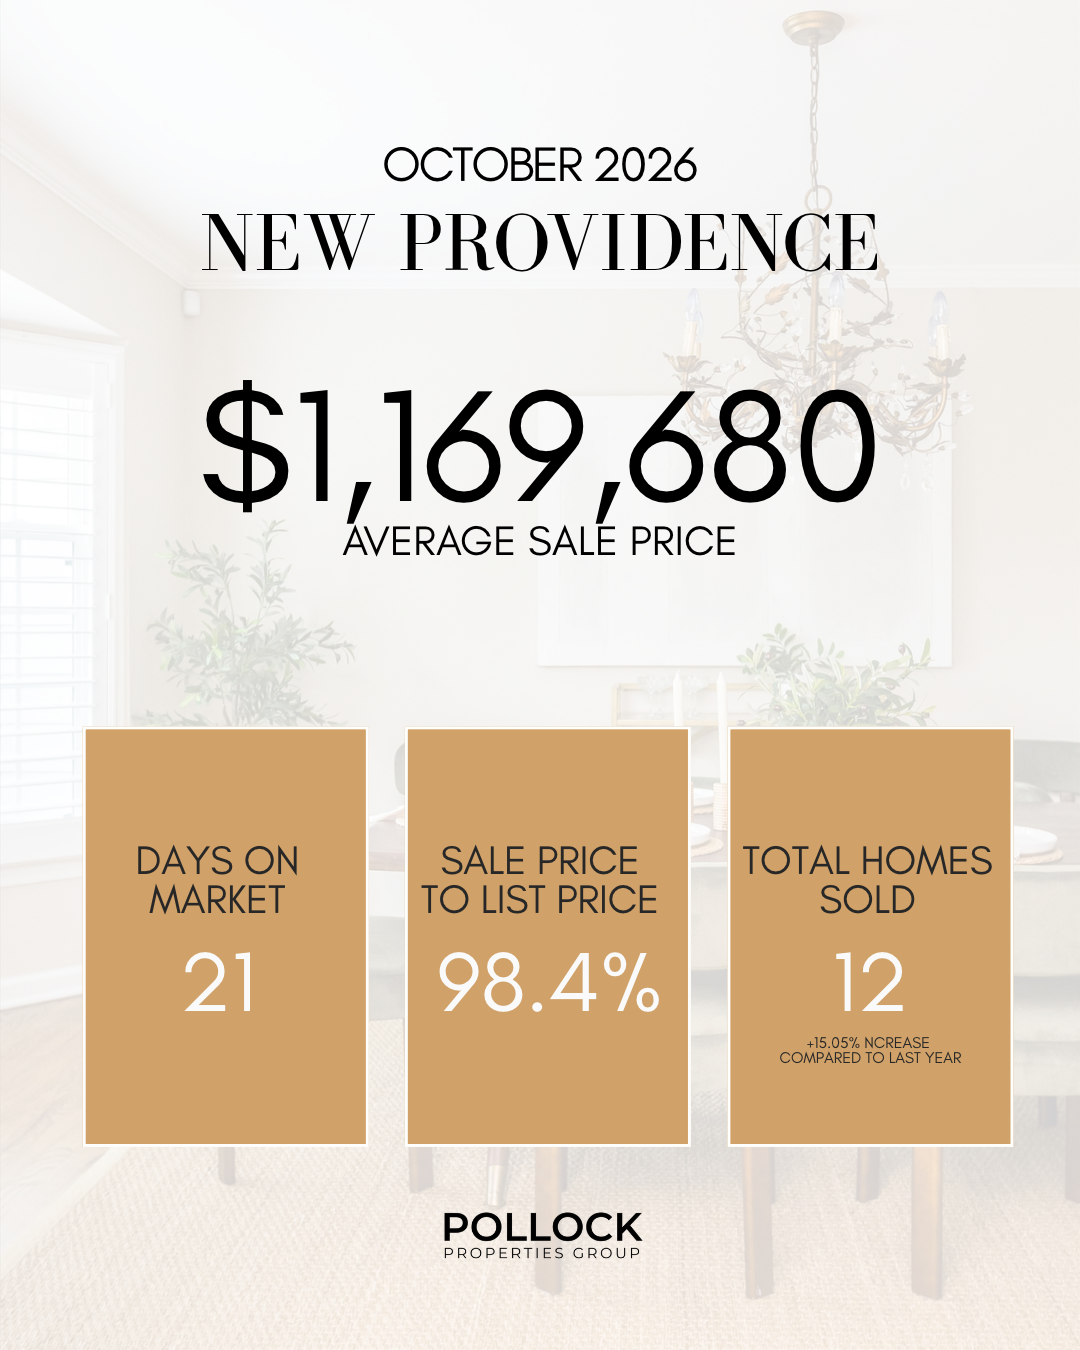
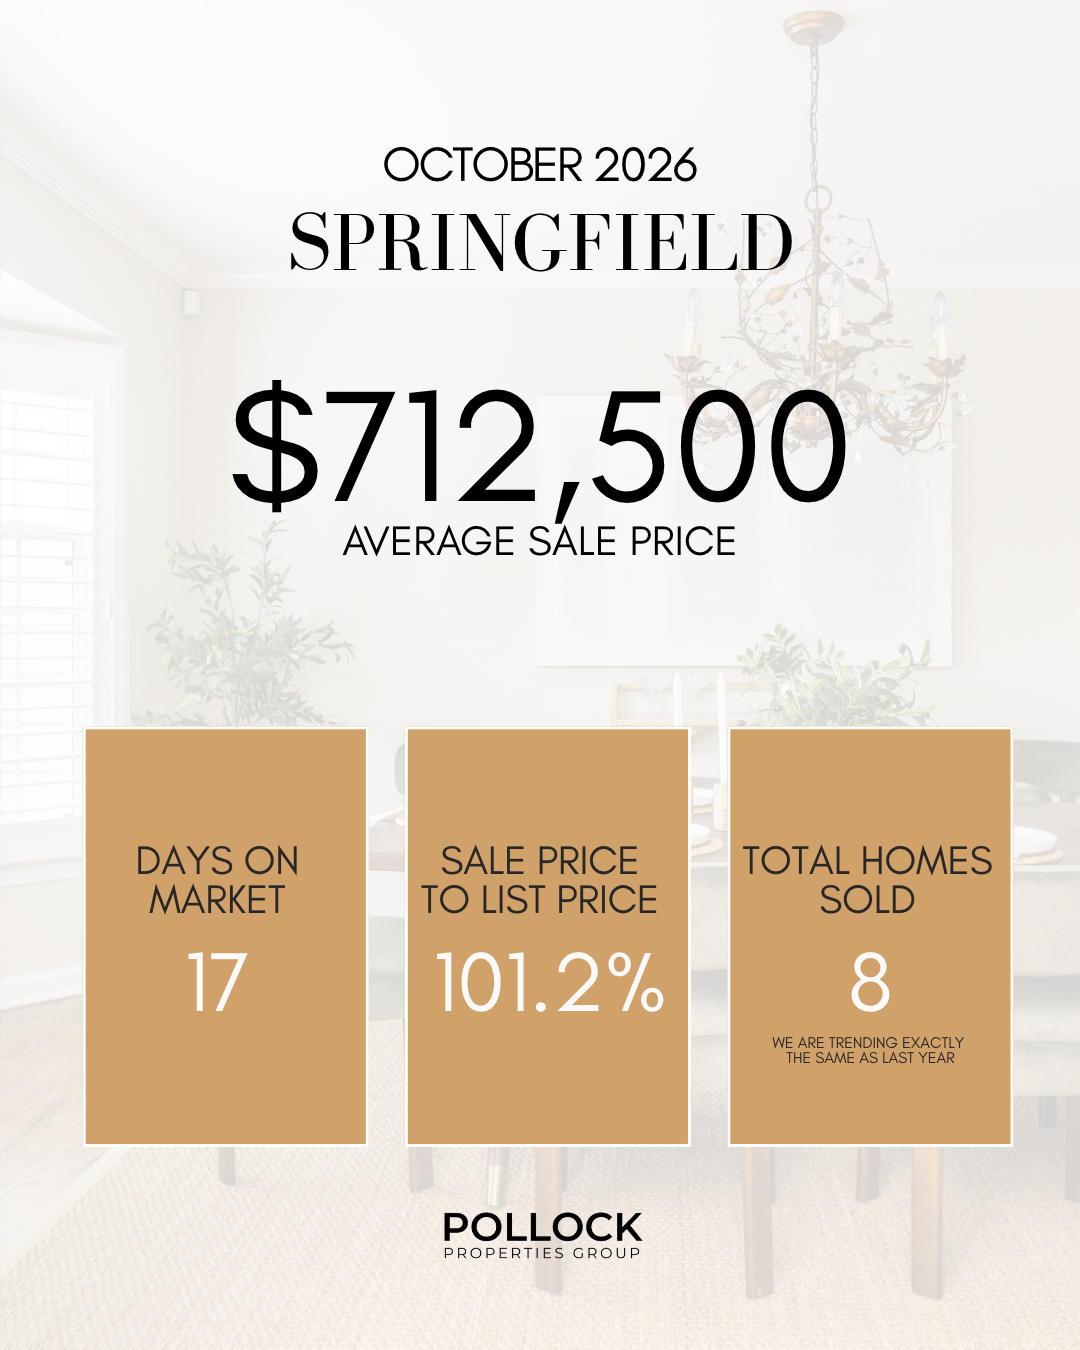
Somerset County Town
Whether you're imagining a move, preparing to list, or trying to understand your home’s value — we’re here.
Contact us at PollockPropertiesGroup.com
DM us anytime
We’re always just a porch chat away.
Subscribe to our newsletter for weekly market updates and insights.

